Live
- Chanchalguda Jail Officials Say They Haven't Received Bail Papers Yet, Allu Arjun May Stay in Jail Tonight
- BJP leaders present evidence of illegal voters in Delhi, urge EC for swift action
- Exams will not be cancelled: BPSC chairman
- Nagesh Trophy: Karnataka, T.N win in Group A; Bihar, Rajasthan triumph in Group B
- YS Jagan condemns the arrest of Allu Arjun
- Economic and digital corridors to maritime connectivity, India and Italy building vision for future, says Italian Ambassador
- SMAT 2024: Patidar's heroics guide Madhya Pradesh to final after 13 years
- CCPA issues notices to 17 entities for violating direct selling rules
- Mamata expresses satisfaction over speedy conviction in minor girl rape-murder case
- Transparent Survey Process for Indiramma Housing Scheme Directed by District Collector
Just In
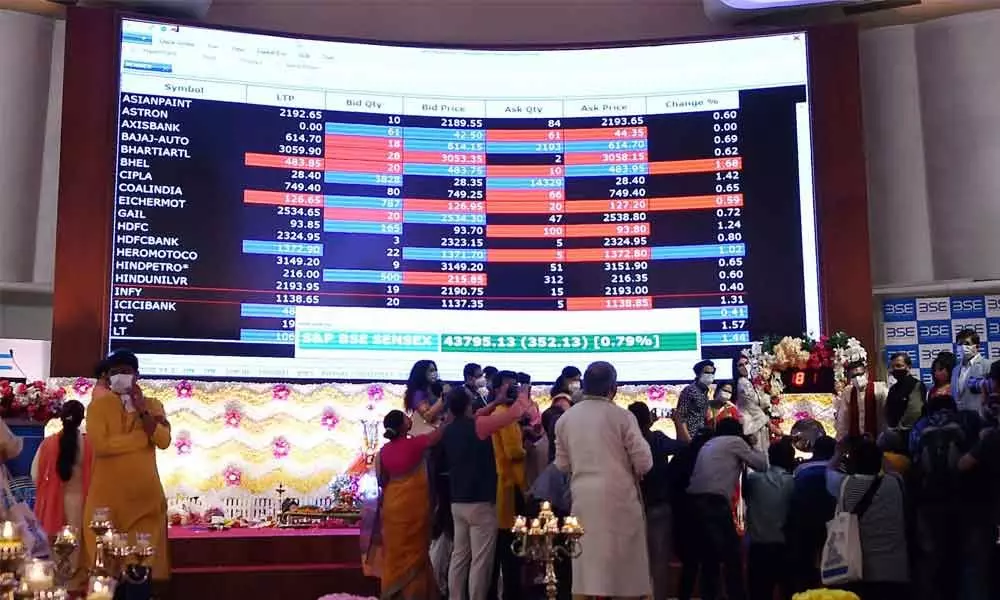
Muhurat trading: Markets soars to lifetime high on Samvat-2077


Muhurat trading: Markets soars to lifetime high on Samvat-2077
The equity markets across the globe ended with decent gains during the last week. The Nifty continued its rally and advanced by 516.70 points or 4.21...
The equity markets across the globe ended with decent gains during the last week. The Nifty continued its rally and advanced by 516.70 points or 4.21 per cent, including Muhurat trading gains. The BSE Sensex gained by 3.8 per cent, and the broader indices also followed the benchmarks. The Nifty Midcap-100 and Smallcap-100 indices inched up by 3.1 per cent and 3.7 per cent. On the sectoral front, the Nifty Metal index up by 7.2 per cent. Barring Nifty IT index, all other indices closed higher during the last week. The overall market advance-decline ratio is positive, and the number of stocks making their 52-week highs is increasing every day, is a good sign of the bull market. The FIIs are aggressively buying the equities, and they bought Rs. 33,232.17 crore worth of equities in the current month.
After breaking of all resistances, the Nifty reached to an uncharted territory during the last week. It formed a bullish candle on the weekly chart. The benchmark index is moving an upward channel consolidating within Wednesday's bar. It closed above the upper Bollinger band, may lead to more consolidation. For the first time, the Nifty formed a full bar above the Bollinger band in the last decade. This shows an extreme over the bought condition in the market. As the general of Bollinger bands, it will not sustain above the bands not more than two to three bars. So expect the Nifty range could be limited to a very narrow. During the last week, the Nifty moved in 400 points range, after a 700 points haul in the previous week. Overall, the Nifty rose by 9.26 per cent in the last two weeks. Generally, any sharp will lead to consolidation before continuing the trend or reversing. The India VIX suggesting that the risk-reward ratios are not suggesting for an aggressive long position. At the same time as there is no weakness in the market, the FII flow has been the highest level. It better avoids any kind bearish view at the current juncture.
Currently, the Nifty is trading 4.83 per cent above the 20DMA. On a historical chart, the Nifty tries to retrace towards the 20DMA after moving 6 to 7 per cent above to it. After moving 6.15 per cent above to it, the index is in the process of reaching a mean level (20DMA). At the same time, the MACD histogram is also cooling off. These are the indication of the market is going consolidate for some time before resuming the current trend or reversing. The RSI is above the 75 levels, in an extreme overbought condition. On a monthly chart, there is significant negative divergence since January 2018. The price is making higher highs, but the indicator did not. As the price is at a long-term resistance and the indicators are in an extreme overbought condition, it is time to be cautious on the index.
On a longer-term chart, the Nifty reached a strong resistance level. A move above 13000-13260 will act as a stronger resistance zone. The support zone is at 12478-12298. Below this zone, the Nifty may finds support at 20DMA, placed at 12063. There is no distribution day at the moment; the market condition is in a confirmed uptrend. In any case, the Nifty adds distribution days and a fall over 2 per cent with an above-average volume, exit the current long positions and wait for a next confirmed trend signal. As the Nifty PE reached to 34.57, the Valuations of the overall market is not at attractive levels. In this condition, select the stocks which are showing a consistence growth over the period. Look at the price strength and the earnings strength before investing. Stick to stocks which are making higher highs on weekly or monthly charts. (T.Brahmachary-Financial Journalist, Technical Analyst, Trainer, Family Fund Manager)
(The author is a financial journalist and technical analyst. He can be reached at [email protected])

© 2024 Hyderabad Media House Limited/The Hans India. All rights reserved. Powered by hocalwire.com


