Live
- BRS MLA Prakash Goud jumps ship to Cong, more to follow?
- Upbeat TDP cadres focus on one lakh majority for Naidu in Kuppam
- Bhatti knocks on doors of CPM for support in LS polls
- Rajamahendravaram: Purandeswari takes part in huge rally, files nomination
- Inter results likely to be released on Apr 22
- Ongole: Police crack theft of ₹66 lakh from ATM cash deposit vehicle
- TS received only Rs 3.7 lakh cr, not Rs 10 lakh cr: Deputy CM
- YSRCP, TDP candidates file nominations
- Gold rates in Delhi surges, check the rates on 20 April 2024
- Gold rates in Visakhapatnam surges, check the rates on 20 April 2024
Just In

Last week, Indian stock market witnessed a sharp decline As we cautioned, the Nifty continued to be in the red zone whole week The BSE Sensex ended with 737 points or 2 per cent loss and Nifty closed negative by 219 points or 2 per cent The Midcap and Smallcap indices continued their sharp decline by 24 per cent and 36 per cent Terror attack in Kashmir on Friday created some huge volatility
Last week, Indian stock market witnessed a sharp decline. As we cautioned, the Nifty continued to be in the red zone whole week. The BSE Sensex ended with 737 points or 2 per cent loss and Nifty closed negative by 219 points or 2 per cent. The Midcap and Smallcap indices continued their sharp decline by 2.4 per cent and 3.6 per cent. Terror attack in Kashmir on Friday created some huge volatility in markets.
Pharma, metals and auto indices were the worst performers last week. The stocks across all the sectors took a beating. The border tensions, rising crude oil prices, declining rupee were significant reasons for dampening the sentiment. Despite some positive macroeconomic factors like factory output for December increasing from 0.3 per cent to 2.4 per cent, the market mood remained bearish as fund flow into the market is moderated in the past two months.
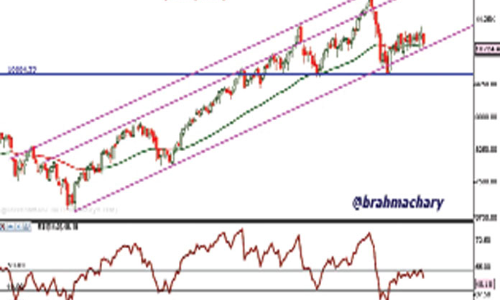
As we discussed last week, the bearish shooting star pattern on a weekly chart had the confirmation by closing much below the last closing level. With this evidence, the Nifty may go further down as many other aspects are also showing similar technical pieces of evidence. Though there was a sharp recovery on Friday afternoon from lower levels, it could not close even a shorter term 20 days moving average.
After breakout failure last week, it came down to the support level again. On a weekly chart, it took support exactly at 78.6 per cent Fibonacci retracement of the prior upward swing. And also trend line drawn by connecting Feb-Dec 2016 lows, worked as major support once again. We need to observe whether this support will hold even next week.
The leading RSI indicator is near to the historical support level and the Stochastic Oscillator crossover is at extreme low, suggesting that there are chances to pullback action. If there is any pullback in the market, it needs to clear the first resistance at 10810-15, which is also a 50 DMA level. At the same time as long as it holds Friday’s low (10620), avoid short positions and any fresh short opportunities will arise only below that.
The overall structure of the market is still within the range of 10585- 10985. As I mentioned earlier within this range, each swing is up or down sustained only for 4 - 6 days. So, any upward move may be short-lived. Before taking a decisive move, Nifty may spend more time within the range.
The longer period consolidation will lead a sharper move either side after violating the range. Stock specific activity will continue and most of them are news or earning driven. Avoid trading in Midcap and Smallcap as they are the worst performers and these thematic indices are suggesting more downfall is due.
I expect another 25-30 per cent correction in Midcap and Smallcap indices. Be cautious while trading as you may witness some unexpected moves takes place. Stick to large-caps to trade and concentrate on risk management. (The author is a financial journalist and technical analyst. He can be reached at tbchary@gmail.com)
By Thivoti Brahmachary

© 2024 Hyderabad Media House Limited/The Hans India. All rights reserved. Powered by hocalwire.com


