Live
- GMR Airports Unveils AI-Powered Digital Twin Platform to Transform Airport Operations
- India poised to become leading maritime player: PM Modi
- Top Causes of Kidney Stones and How to Recognize Silent Symptoms
- India’s renewable energy capacity logs 14.2 pc growth at 213.7 GW
- Winter Session of Odisha Assembly adjourned sine die
- Biden calls Trump's tariff approach 'major mistake'
- After Drama Over Eknath Shinde’s Chief Minister Race, Maharashtra Cabinet Formation Faces New Tensions
- Egyptian FM, Blinken discuss recent developments in Syria
- Iran's supreme leader says Syria's developments result of US-Israeli 'plot'
- Elon Musk to Purchase $100 Million Luxury Mansion Next to Donald Trump's Mar-a-Lago, Report Reveals
Just In

Inflation in India is usually measured by Wholesale Prices Index (WPI) and Consumer Prices Index (CPI). Data on CPI (Industrial Workers) is available for Telangana State during 2011-12 to 2015-16.
Trends in Inflation
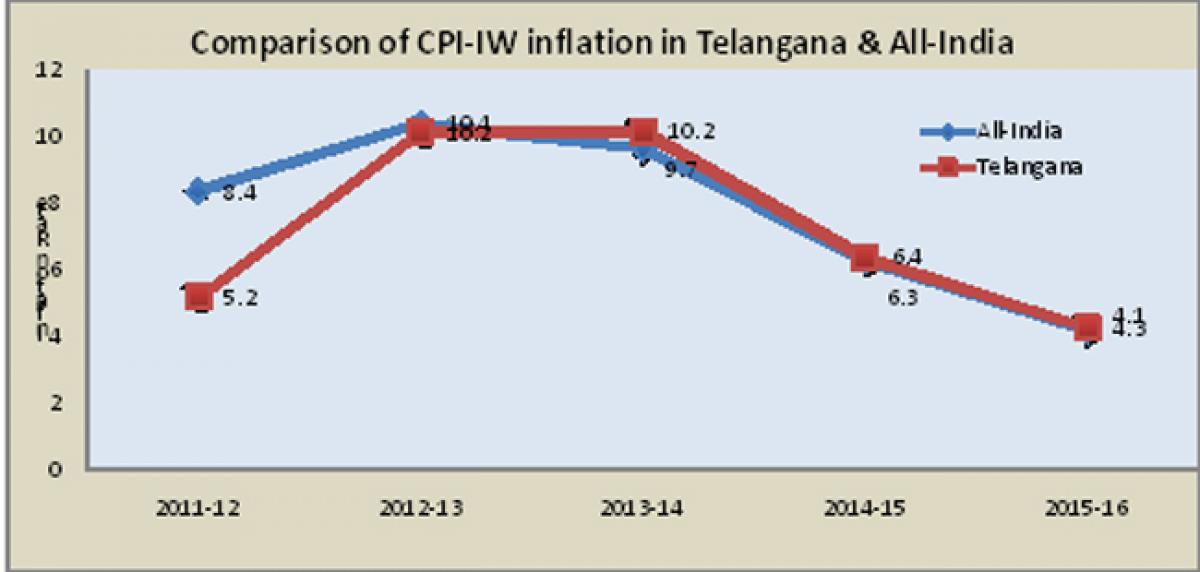
Inflation in India is usually measured by Wholesale Prices Index (WPI) and Consumer Prices Index (CPI). Data on CPI (Industrial Workers) is available for Telangana State during 2011-12 to 2015-16. Trend in CPI (IW) indicates that inflation in Telangana is moving in same line as that of all-India (see Figure 2.7).
Figure 2.7: Comparison of CPI (Industrial Workers) inflation in Telangana and India
High Inflation was observed during the years 2012-13 and 2013-14 and exhibited a downward trend in the following years. CPI (IW) inflation came down to 4.3 from in the year 2015-16, giving a sign of relief to the consumers.
IV. Public Finance
Public (Government) investment is an engine of economic development. Government spending on programmes/schemes create what is called as "public goods" such as infrastructure facilities, education, healthy and skilled labour force, clean environment, disease-free society etc. The positive externalities emitted out of these 'public goods' create conducive environment for private investments. Therefore, some of the developmental theorists advocate that Governments in developing countries should inject large public investment in education, health, infrastructure etc. to bolster economic growth. In fact, Government spending could only turnaround the economy in times of economic recession. Since its formation, Government of Telangana has been making sincere efforts to mobilise resources for filling-up critical developmental gaps.
1. Revenue Mobilisation:
Information on Telangana's public finances is available for 2014-15 (both Budget Estimates and Actual) and 2015-16 (Budget Estimates). Total receipts of Telangana during 2014-15 (Actuals) were Rs. 60,699 crore (for the period 02.06.2014 to 31.03.2015) as against the Budget Estimates of Rs. 98,099 crore. Of the total receipts in 2014-15 (Actuals), tax revenues (including share of Central Taxes) occupies major share with Rs. 37,477crore. The total receipts in 2015-16 (BE) is estimated to be 1,15,686 crore (See Table 2.5).
Table 2.5: Receipts on Consolidated Fund of Telangana (Rs. in Crore)
| Sl. No | Particulars | 2014-15* (Budget Estimates) | 2014-15* Actuals | 2015-16 (Budget Estimates) |
| I | Revenue Receipts (1+2+3) | 80,090 | 51,042 | 94,132 |
| 1 | tax revenue (including share of Central Taxes) | 45,128 | 37,477 | 59,318 |
| 2 | Non-Tax Revenue | 13,242 | 6,447 | 22,413 |
| 3 | Grant-in-aid from Central Government | 21,721 | 7,118 | 12,400 |
| II | Capital Receipts | 18,008 | 9,657 | 21,555 |
| Total Receipts (I+II) | 98,099 | 60,699 | 115,686 | |
Note: *2014-15 data pertains to 02.06.2014 to 31.03.2015.
2. Major Taxes for the State:
An analysis of State tax resources reveal that sales tax is the predominant contributor to the State tax resources with 75 percent contribution, followed by State Excise with 10% contribution, Taxes on Motor Vehicles 6 percent and Stamps and Registration with 7 percent (see Figure 2.8).
3. Expenditure Pattern:
Functional classification of total expenditure reveals that in the year 2014-15 (Actuals), highest budget spending of Rs. 24,978 crore was incurred on 'economic sector' consisting of agriculture, rural development, irrigation, energy, industry, transport etc. followed by 'social sector' and 'general services'. Similarly, Budget of 2015-16 provided higher allocations for 'economic and social sector' (see Table 2.6).
Table 2.6: Expenditure by Function and Nature (Rs. crore)
| Sl. No | Particulars | 2014-15* (Budget Estimates) | 2014-15* Actuals | 2015-16 (Budget Estimates) |
| 1 | General Services | 25,661 | 14,570 | 29,108 |
| 2 | Social Services | 34,563 | 20,834 | 39,741 |
| 3 | Economic Services | 40,414 | 24,978 | 46,840 |
| Total Expenditure (1+2+3+4) | 100,638 | 60,382 | 115,689 | |
Note: *2014-15 data pertains to 02.06.2014 to 31.03.2015.
OUTLOOK
Telangana State has been outperforming many of the Indian States in terms of economic indicators. Specifically, the State has performed very well in terms of per capita income and GSDP growth. The present Government has undertaken sector-specific initiatives to further improve business environment in the State.
G.Rajendera Kumar

© 2024 Hyderabad Media House Limited/The Hans India. All rights reserved. Powered by hocalwire.com


