Live
- Air ambulance for health emergencies: Helipad to come up in Victoria Hospital
- Karthigai Deepam Wishes: WhatsApp Status, Messages to Celebrate the Festival of Light
- Top Different Industry Trends of 2024 and What to Expect in 2025
- India’s Leading Lending Platforms: How Technology is Transforming Credit Access
- WhatsApp Update: WhatsApp To Add an In-App Translation Feature
- Govt healthcare: Long hours of unavoidable waiting for poor
- Readymade models rule the roost
- Teacher masterminds fake certificate racket!
- Villagers stage protest for road
- Daily Horoscope for December 13, 2024: What Are Your Stars Saying Today
Just In

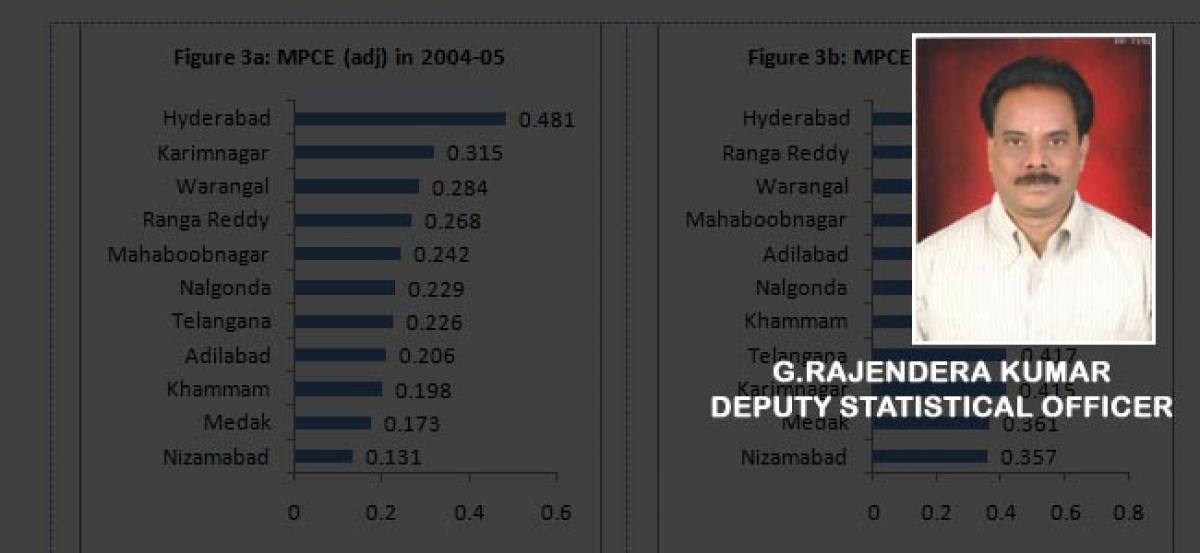
The indices of components of HDI indicates, there has been significant improvement in the standard of living index (using Monthly Per Capita Expenditure (MPCE) adjusted for inequalities) across the districts. In terms of ranking of the standard of living index, Karimnagar district slipped from 2nd place to 8th, mostly because of low MPCE growth and higher inequalities, while other districts have
##BIG-IMAGE#The indices of components of HDI indicates, there has been significant improvement in the standard of living index (using Monthly Per Capita Expenditure (MPCE) adjusted for inequalities) across the districts. In terms of ranking of the standard of living index, Karimnagar district slipped from 2nd place to 8th, mostly because of low MPCE growth and higher inequalities, while other districts have either retained their ranks or improved them (Figure 4).
Figure 5 presents the values of standard of living index (MPCE) in 2004-05 and percentage change in it between 2004-05 and 2011-12. It shows very clearly that the districts with a low value of standard of living index in 2004-05 had increased their index value faster compared to the districts with a higher index values. This reflects the declining inequalities in this indicator across the districts.
In case of the health index, the ranks of Warangal, Nalgonda, Medak and Nizamabad have slipped during 2011-12 (Figure 7). While Warangal and Nizamabad experienced a moderate decline in the ranking of health index from 3 to 4 and 6 to 7 respectively; Nalgonda slipped from 4th rank to 6th but Medak fell drastically from 6th position to 9th position.
Figure 8 presents the values of health index in 2004-05 and percentage change in it between 2004-05 and 2011-12. It shows very clearly that the districts with a low value of health index in 2004-05 had increased their index value faster compared to the districts with a higher index values. This reflects the declining inequalities in this indicator across the districts. Two districts viz. Karimnagar and Ranga Reddy have shown higher values of index during 2004-05 and high growth between 2004-05 and 2011-12.
In the case of education index, Adilabad and Mahbubnagar districts experienced moderate decline from 3 to 4 and 9 to 10 respectively; Nalgonda lost 4 ranks moved from 4th rank to 8th rank but Warangal slipped from 2nd rank to 7th rank (Figure 10).
Figure 11 presents the values of education index in 2004-05 and percentage change in it between 2004-05 and 2011-12. It shows very clearly that the districts with a low value of education index in 2004-05 had increased their index value faster compared to the districts with a higher index values. This reflects the declining inequalities in this indicator across the districts. Ranga Reddy district had high value of education index during 2004-05 and grew at a higher rate between 2004-05 and 2011-12.
Table 2: Components of Human Development Index
| District | MPCE (Adj) | Health | Education | |||
| 2004-05 | 2011-12 | 2004-05 | 2011-12 | 2004-05 | 2011-12 | |
| Adilabad | 0.206 | 0.453 | 0.323 | 0.568 | 0.364 | 0.509 |
| Hyderabad | 0.481 | 0.650 | 0.747 | 0.888 | 0.700 | 0.774 |
| Karimnagar | 0.315 | 0.415 | 0.396 | 0.684 | 0.345 | 0.499 |
| Khammam | 0.198 | 0.435 | 0.347 | 0.597 | 0.341 | 0.537 |
| Mahbubnagar | 0.242 | 0.457 | 0.275 | 0.500 | 0.296 | 0.437 |
| Medak | 0.173 | 0.361 | 0.372 | 0.558 | 0.277 | 0.441 |
| Nalgonda | 0.229 | 0.448 | 0.396 | 0.578 | 0.363 | 0.484 |
| Nizamabad | 0.131 | 0.357 | 0.372 | 0.568 | 0.324 | 0.500 |
| Ranga Reddy | 0.268 | 0.553 | 0.505 | 0.733 | 0.357 | 0.546 |
| Warangal | 0.284 | 0.470 | 0.408 | 0.665 | 0.390 | 0.487 |
| Telangana | 0.226 | 0.417 | 0.414 | 0.633 | 0.357 | 0.502 |
Note: MPCE (Adj): Monthly Per Capita Expenditure adjusted for inequality, Infant Mortality Rate and literacy and mean years of schooling are taken as indicators for standard of living, health and education respectively.
Source: Draft HDI Report 2011-12(2014), CESS Hyderabad
By G Rajendra Kumar

© 2024 Hyderabad Media House Limited/The Hans India. All rights reserved. Powered by hocalwire.com


