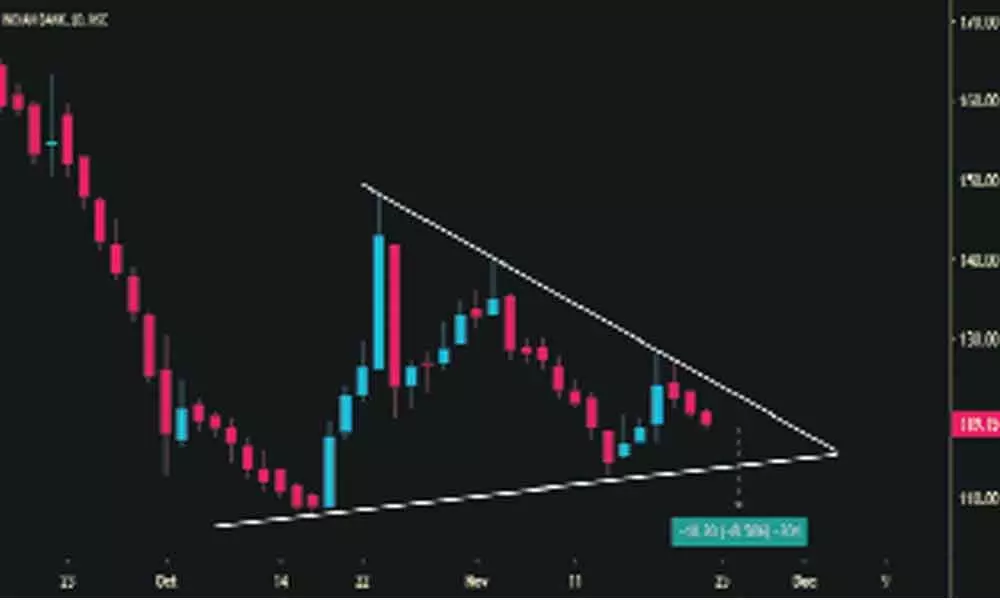
TradingView charts helpful for investors

TradingView charts helpful for investors
x
Highlights

TradingView is a stock charting and analysis software available in both free and paid options. It offers a free website for chart obsessed investors....

TradingView is a stock charting and analysis software available in both free and paid options. It offers a free website for chart obsessed investors. It emphasises on visual charts. Its market data is freely accessible. It's easy and intuitive for beginners and powerful enough for advanced chartists. It has all the charting tools. Real time data and power-based charts let you do your research and access data from anywhere. In the paid version, the user gets many advantages but for now let us take a look at the options available in free version.

After selecting any stock open the chart in full featured view and in the details section you get a clear picture of the 52-week high and low and the current news related to the stock. The most popular and widely used chart is 15-minute candlestick chart. Intraday traders use 15-minute timeframe and investors refer to a daily chart.

In the free version of the TradingView, one gets to use only three indicators at a time. For instance, if one wants to use exponential moving average indicator then we usually plot 20,50,100 and 200. Suppose this indicator is to be coupled with CPR indicator then it is not possible in free TradingView. But thanks to some youtubers like Gomti Shankar who have merged CPR with 5 moving averages as one single indicator, one can still use volume and MACD even in the free version.

Several youtubers use Pine Script to create custom indicators and run them on their servers. Their efforts in this regard are not only commendable but they also help millions of small traders. For small traders, it would be difficult to invest some annual amount as a fee. For such traders, the availability of such features comes as a blessing in disguise. TradingView has a competitive edge when compared to others because of its many additional features. For those who want to back test any trade, there is a feature called bar replay where you can play the candlestick chart with low speed and try to assess yourself about the probability of the trade. This feature is available in pro and premium versions on all time frames. Instead of jumping into real trade, one can learn from this option by using virtual trade. Pro version has definitely many more features to offer but as it comes with a cost, for beginner's, free version would suffice.

(The author is a homemaker who dabbles in stock market investments in free time)

Show Full Article
Print Article
Next Story
More Stories
ADVERTISEMENT
ADVERTISEMENTS