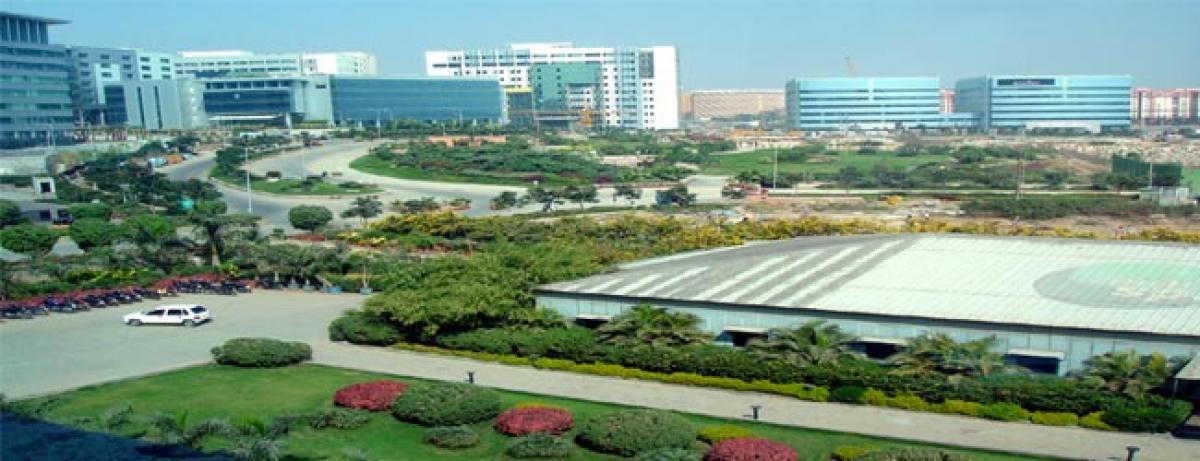
Hyderabad's green cover fell from 2.71 to 1.66 percent over 20 years

Findings of a new Indian Institute of Science study that used satellite-borne sensors, compared images over decades and modeled past and future growth reveal the rate of urbanisation in four Indian cities.
Findings of a new Indian Institute of Science study that used satellite-borne sensors, compared images over decades and modeled past and future growth reveal the rate of urbanisation in four Indian cities.
- Kolkata’s tree cover fell from 23.4 percent to 7.3 percent over 20 years; built-up area up 190 percent. By 2030, vegetation will be 3.37 percent of Kolkata’s area.
- Ahmedabad’s tree cover fell from 46 percent to 24 percent over 20 years; built-up area up 132 percent. By 2030, vegetation will be 3 percent of Ahmedabad’s area.
- Bhopal’s tree cover fell from 66 percent to 22 percent over 22 years. By 2018, it will be 11 percent of city’s area.
- Hyderabad’s tree cover fell from 2.71 percent to 1.66 percent over 20 years. By 2024, it will be 1.84 percent of city’s area
T.V. Ramchandran, a professor, and his team at the Energy and Wetlands Research Group, Centre for Ecological Sciences, studied “agents of change” and “drivers of growth”, such as road networks, railway stations, bus stops, educational institutions and industries; defence establishments, protected regions, such as reserve forests, valley zones and parks.
The researchers classified land use into four groups: Urban or “built-up”, which includes residential and industrial areas, paved surfaces and “mixed pixels with built-up area”, meaning built-up areas which contain areas from any of the other three categories-water, which includes tanks, lakes, reservoirs, and drainages; vegetation, which includes forests and plantations; and others, including rocks, quarry pits, open ground at building sites, unpaved roads, cropland, plant nurseries and bare land.
Here is what they found in each city.
Kolkata: The population of Kolkata is now 14.1 million, making it India’s third-largest city. Urban built-up area, as we said, increased 190 percent between 1990 and 2010. In 1990, 2.2 percent of land was built up; in 2010, 8.6 percent, which is predicted to rise to 51.27 percent by 2030.
Hyderabad: With a population of 7.74 million in 2011, Hyderabad is poised to be a mega city with 10 million people in 2014. Urban built-up area rose 400 percent between 1999 and 2009. In 1999, 2.55 percent of land was built up; in 2009, 13.55 percent, which is predicted to rise to 51.27 percent by 2030.
Ahmedabad: With 5.5 million in 2011, the city was India’s sixth largest by population and third-fastest growing city. Ahmedabad’s built-up urban area grew 132 percent between 1990 and 2010. In 1990, 7.03 percent of land was built-up; in 2010, 16.34 percent, which is predicted to rise to 38.3 percent in 2024.
Bhopal: One of India’s greenest cities, it is 16th largest by population with 1.6 million people. Bhopal is better off than other cities even today, but the concretising trend is clear: In 1992, 66 percent of the city was covered with vegetation (in 1977, it was 92 percent); that is down to 21 percent and falling.
India’s urban population rose 26 percent over the decade ending 2010 to 350 million, according to United Nations data, and is projected to rise 62 percent between 2010 and 2020 and 108 percent between 2020 and 2030.
India’s fastest growing city has traditionally been Bengaluru. There are no recent estimates for its concretisation, but in 2012, Ramachandran and his group found a 584 percent growth in built-up area over the preceding four decades, with vegetation declining 66 percent and water bodies 74 percent, according to this study.
The highest increase in urban built-up area in Bengaluru was evident between 1973 and 1992 -- 342.83 percent. Decadal increases since, between 1992 and 2010, have averaged about 100 percent: 129.56 percent from 1992 to 1999; 106.7 percent from 1999 to 2002; 114.51 percent from 2002 to 2006; and 126.19 percent from 2006 to 2010.
Bengaluru’s population rose from 6.5 million in 2001 to 9.6 million in 2011, a growth of 46.68 percent over a decade; population density increased from 10,732 persons per square kilometre in 2001 to 13,392 persons per square kilometre in 2011.
The 2013 study by Ramachandra listed implications of unplanned urbanisation:
Floods: As open fields, water bodies, wetlands, and vegetation are converted to residential layouts, roads, and parking lots, absorption of rainfall reduces. Encroachment of natural drains, alteration of the topography, such as construction of high-rise buildings, causes flooding, even during normal rainfall.
Heat island: Increased consumption of energy causes energy discharges, creating heat islands with higher surface and atmospheric temperatures.
Increased carbon footprint: High consumption of electricity, building architecture, more vehicles and traffic bottlenecks contribute to carbon emissions-a situation aggravated by mismanagement of garbage.
By Deepa Padmanaban
(In arrangement with IndiaSpend.org, a data-driven, non-profit, public interest journalism platform. Deepa Padmanaban is a Bengaluru-based journalist, specialising in public-health reporting. The views expressed are those of IndiaSpend. The author can be contacted at [email protected])


