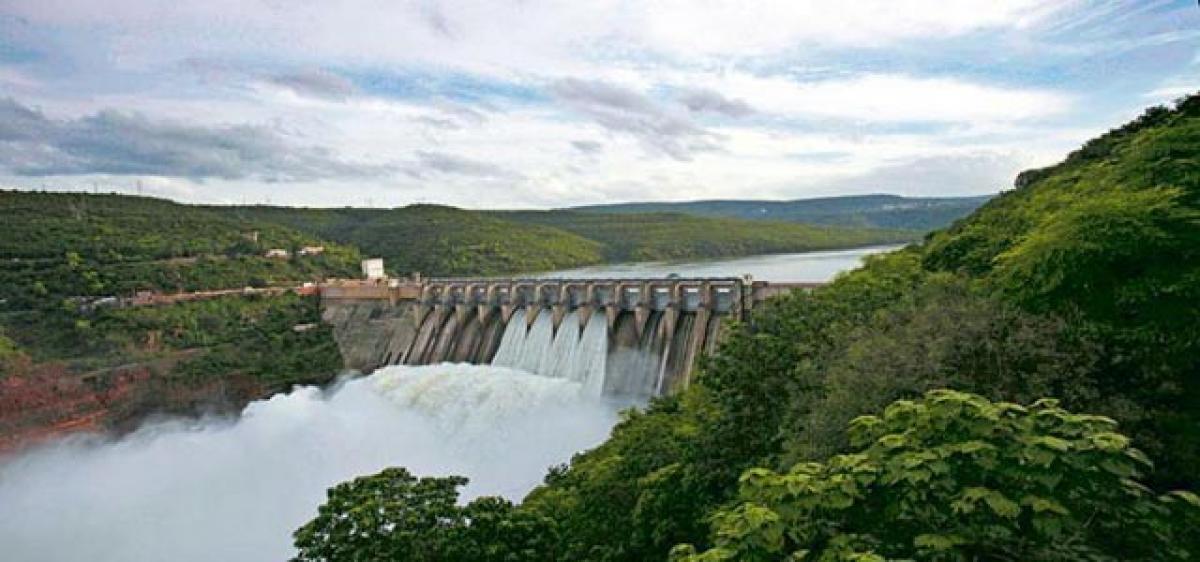
Facts of Krishna water sharing

The Hans India [5th December 2016] presented a news item “Cabinet sub-committee: Govt to continue legal battle over water sharing.
The Hans India [5th December 2016] presented a news item “Cabinet sub-committee: Govt to continue legal battle over water sharing.” Both the Telugu states appointed ministerial sub-committees to tackle the issue of dispute of Krishna river water sharing. However, the issue is going in a wrong directing. This is not a legal issue but is a technical-political issue.
Justice Brijesh Kumar Tribunal (hereafter referred to as “the Tribunal”) committed a technical fraud in its award to favour Karnataka at the cost of undivided AP. There are several scenarios in the “Technical Fraud.” These are presented under data manipulations, probability manipulations and hence their implications for two Telugu states.
The first Tribunal used 78 years data set that was available at the time, namely 1894-95 to 1971-72 which was agreed to by the three riparian states. Though Justice Brijesh Kumar Tribunal has 114 years data series [1894-95 to 2007-08] but it used selected data series of 1961-62 to 2007-08 of 47 years only, which was not agreed to by AP; and yet, the Tribunal used five different data sets to prove their unethical arguments.
The average of 47 years data series is higher than 78 data series by 185 TMCFT. The Tribunal put forth several subjective, unscientific and illogical arguments without giving scientific reasoning for doing so. The tribunal argued that “They [47 and 78 years data series] do not match hence cannot be integrated”; “Such increase [185 TMCFT] as reflected seems to be quite natural & obvious ---“; “The longer the time series [114 years data series], however, greater the chance that it is neither stationary, consistent nor homogeneous”; and “we are of the opinion that 47 years length of the series should be considered sufficient to assess water availability of river.
It more than fulfils the minimum requirement of IS Code ---.” The AP rainfall data series since 1871 presented a 132-year cyclic pattern in which 66 years each form part of below & above the average pattern in successive periods, the period prior to 1935 presents below the average pattern and the same is now started from 2001; and from 1935 to 2000 which presents above the average pattern.
The water availability data of 114 years follows the rainfall pattern. That is 78 years and 47 years data sets form part of below and above the average patterns only. Thus the average of 78 years data set is lower than the average of 47 years data set and as well under sine curve pattern [cyclic variation] both form a continuum.
In fact in the below the average period, even delta area did not receive its share of 181.2 TMCFT of water even when all the major projects were not ready to use their share of water on many years. But the Tribunal presented this data in its report. In the present below the average part, N’sagar hasn’t reached its full capacity in many years.
The accuracy of the minimum expected amounts derived at a given probability level depends upon the representativeness of the data used and the degree of skewness in the data set. When a given data series with least skewness follow normal distribution. To get unbiased estimates of water availability at a given probability level, the data series thus must follow normal distribution.
Then such data series are termed as stationary, consistent and homogeneous. The Tribunal did not apply this test. If the data set follows normal distribution then, the Mean coincides with the 50% probability value. In the three data sets of 47, 78 and 114 years, the Mean coincides respectively at 58%, 42% and 48% probability levels.
This clearly suggest that 114 years data series is very close to normal distribution with the Mean at the 48% probability level; and the other two are following skewed distribution with 78 years data showing lesser skew over that of 47 years data series. 114 years data is the best data series for probability study over the other two with 47 years data set on the lower side [poor]. This discounts the inferences made by the Tribunal on longer data series and choosing shorter data series of 47 years for the Study.
By Dr S Jeevananda Reddy

