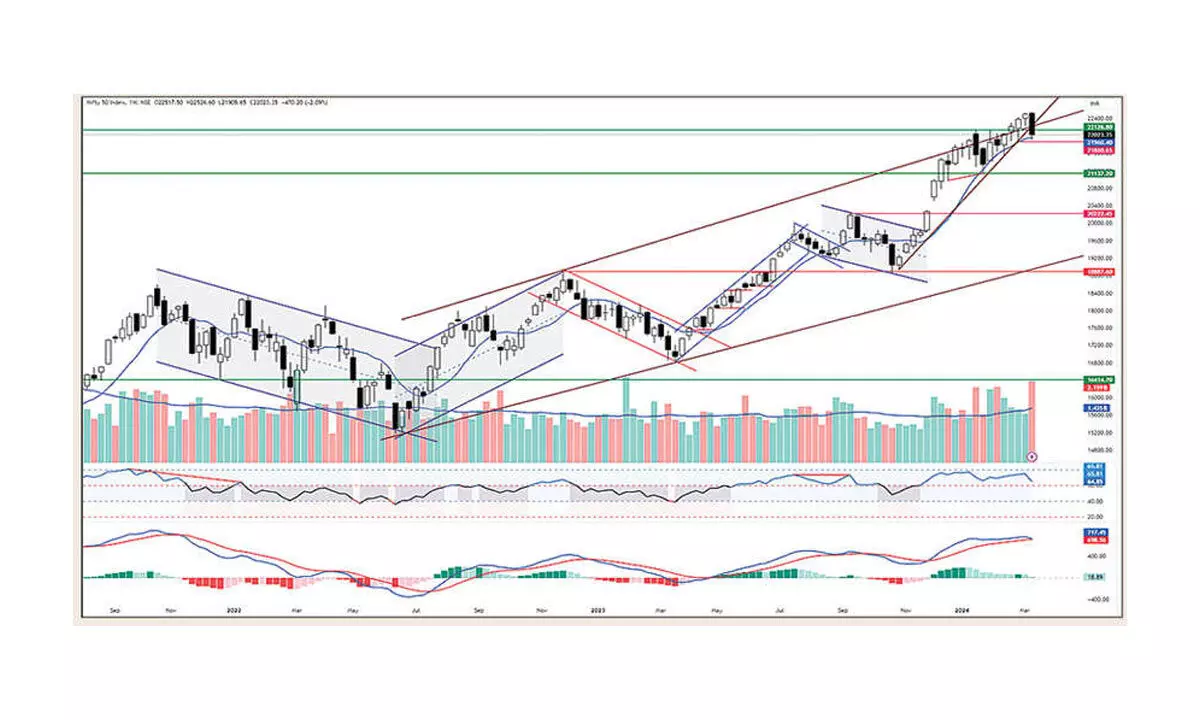
Nifty forms bearish engulfing candle

NSE Nifty ended its four-week winning streak and erased the last three-week gains.
NSE Nifty ended its four-week winning streak and erased the last three-week gains. It declined by 470.20 points, or 2.09 per cent. BSE Sensex is down by 1.99 per cent. The Midcap-100 and Smallcap-100 indices fell by 4.66 per cent and 5.49 per cent, respectively. Only the Nifty IT index could close with a 1.08 per cent gain. All other sectoral indices declined. The PSE and CPSE indices were the worst hit, with a decline of over 9.1 per cent. The PSU Bank index has slipped by 7.90 per cent. The Realty and Media indices declined by 9.43 per cent and 8.34 per cent, respectively. All other indices also succumbed to significant losses. The Market breadth is highly negative. The FIIs bought Rs.9,311.24 crore, and the DIIs also bought Rs.28,046.49 crore worth of stocks this month.
The Nifty finally succumbed to an impulsive corrective move across the market selling pressure. The benchmark index opened with an all-time high on Monday and reacted from a resistance line. A sharp decline on Wednesday, with a 2.44 per cent range, damaged the bullish structure, with a 2.09 per cent net decline on a weekly basis. It erased the previous three-week gains. The Nifty formed a bearish engulfing candle on a weekly chart after seven weeks. Earlier, the decline was limited to just a week after the bearish engulfing candle, and the bulls failed to encash the bearish structure. Since then, the 10-week average acted as solid support. The bulls protected this critical support at least five times in the last eight weeks.
However, this time, a serious decline in the broader market indices does not paint a buoyant picture at all. Importantly, the PSU indices closed below their crucial supports and registered an over nine per cent decline in the last week. But there is a hope of 10-week average support for the benchmark. Last week, the Nifty registered two distribution days and recorded the highest volume on a weekly basis, too. The rising Wedge breakdown on massive volume usually will have serious bearish implications, particularly when it happens at a lifetime high. The pattern breakdown target is near 21,100 points. Interestingly, the prior major low is also at a similar level of 21,137 points.
After failing to negate the bearish divergence, the RSI is back to sub-50 levels. It is almost the prior low. The week’s RSI (64.85) also fell to the prior low. The weekly MACD is about to give a bearish signal, as the histogram is almost at near zero.
(The author is Chief Mentor, Indus School of Technical Analysis, Financial Journalist, Technical Analyst, Trainerand Family Fund Manager)


