Early signals of trend reversal on horizon

Early signals of trend reversal on horizon
Last week has begun with Black Monday and ended with a gap down. The week has given many warnings to the traders
Last week has begun with Black Monday and ended with a gap down.The week has given many warnings to the traders. Thetraders searched reasons for the fall such as geopolitical tensions, declining global markets and so on. But it has found its own way to fall. The Nifty declined 313.75 points or 2.69 per cent during the week. The BSE Sensex lost 2.8 per cent. The Broader market indices Nifty Midcap and Smallcap declined by 2.6 per cent and 3.2 per cent respectively. On the sectoral front, PSU Bank index fell sharply by 8.9 per cent and the realty and energy sector indices lost by 5.5 per cent and 3.4 per cent respectively.
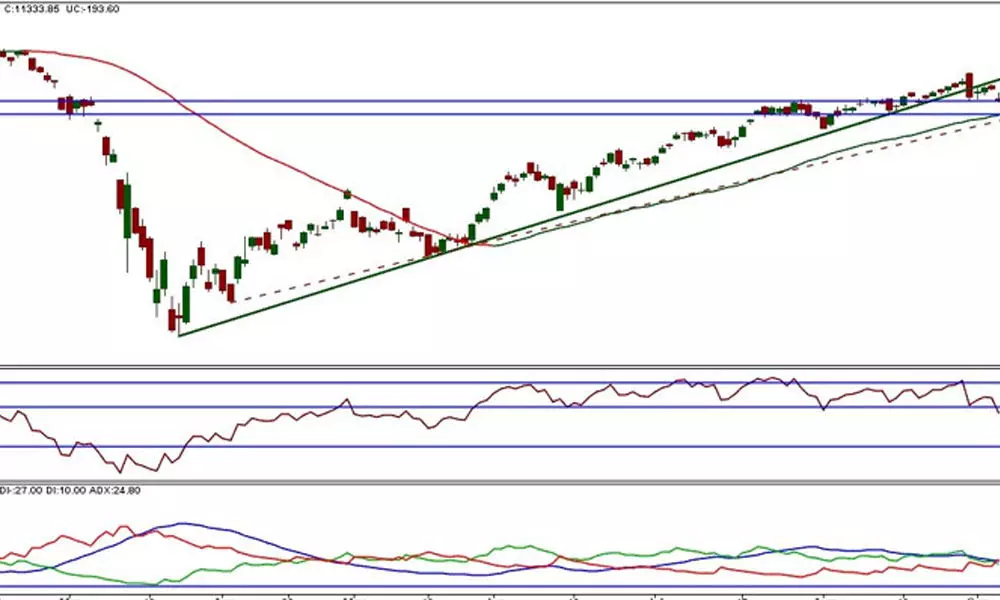
Technically, the NSE Nifty formed a bearish engulfing pattern on a weekly chart and closed below the 20DMA on a daily chart. After 14 weeks of closing above the previous week's low, it failed to do so. At the same time, there are several other candlesticks patterns, including bearish Engulfing in a daily failed many times during the recent rally from the March low. Let us wait for this going to be a reality.
There are only early signals of reversal. It confirms only when closes below the previous swing low of 11,111. There several confluences around that level. The 50DMA is placed at 11,096, and the trend line (dotted) support is placed at the same level. The 11,096-11,111 zone of support is going to be a stronger one. The 50DMA is up trending in a non-curved or a straight line fashion along with the dotted trend line.
Look at the RSI. It is shifting its range towards the bearish zone after May 27. After last week's negation, a fresh negative divergence emerged as the price made a higher high, and the indicator made a lower high. At the same time, it closed below the prior swing low. The -DMI closes above the +DMI and the ADX, which shows the bears coming back with a regained strength.
Along with the crossover of -DMI, the Nifty closed below the 20DMA is also a bearish sign. The negative diverge in the MACD and its histogram also still persists. The, more importantly, the Nifty has five distribution days, which is an indication of a topping formation. These technical factors are pointing out that the high of 11,794 on August 31 could be an intermediate top for. Only in case the Nifty moves above 11,794, the bearish view will be negated. Let us wait and watch the 11,111-11,096 zone of support breaches and reverses the trend or takes support and moves to a new high. We will know by next weekend. Next week's close is very, very important for near-future trend implications.
Sector analysis
From the lows of March 2020, 9 sectors performed better than the broader Nifty-500 index as that index itself rallied 50 per cent during this period. The top-performing sectors include pharma at 75 per cent, auto 73 per cent, smallcap 68 per cent, metal 63 per cent, and media at 62 per cent. Nifty Energy, Midcap, Commodities, and Infra sectors also rallied over 50 per cent. Nifty PSU banks, PSE, Realty, FMCG, and BankNifty, stood at the lower rung of the performance, between 14 per cent & 36 per cent rallies. Nifty Services, Consumption, MNC sectors clocked 40-50 per cent rallies.
(The author is a financial journalist and technical analyst. He can be reached at [email protected])


