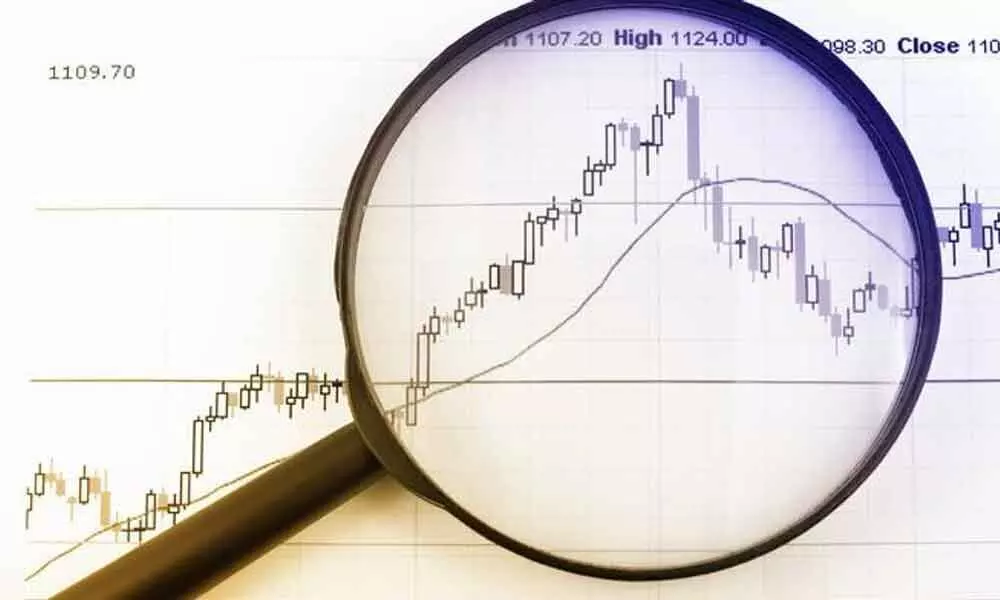
Understanding time frame analysis

Before selecting time frame and understanding multiple time frame analysis, it is important to understand how trend works in different time frames.
Before selecting time frame and understanding multiple time frame analysis, it is important to understand how trend works in different time frames.
In short-term trend cycle, there are scalpers, intraday traders and short-term traders; in medium-term trend cycle, there are swing traders and medium-term horizon traders. In long-term trend cycle, we find positional traders and long-term traders.
In such a situation, short term is like a ripple and medium term is a wave while long term is a tide. Short term trend is less reliable.
It is always better to align with long-term and medium-term trend. Many traders get caught up in identifying the best time frame for intraday trading which is myth.
This approach should be avoided because best time frame depends on how you execute trades in intraday trading. For example, opening range breakout trader would prefer a 15-minute time frame whereas a market profile trader would depend on 30-minute time frame. Trend trader would be comfortable with 3 minutes to 5-minute time frame.
Importance of multiple time frames analysis is always neglected by traders. Through multiple time frames analysis, you increase your probability of success by aligning the higher time frame trend cycle and riding on the short-term trend till it lasts.
In reality, higher time frame and short-term timeframe work together. Higher time frame will guide for trade planning. It helps in assessing broad market direction and will be used to assess risk in the market with regard to volatility and market performance. Smaller time frame will be used basically to enter and exit trades.
Price and volume trend are a result of confluence between various timeframes. Volume picks up as price moves above range. Price moves always in the direction of trend. Whenever there is a breakout, volume begins to expand again.
Adhere to higher time frame for two main reasons. First is to get the direction of the trend and second is to remove random noise on short time frame charts.
If an increase in price is not backed by increase in volume which can be observed only in higher time frame it is definitely suggestive of fall in price of stock.
Long term time frame will be used for trend reference and medium-term time frame will be used for confirmation and short-term time frame will be used for execution which means trade entry and exit.
So, this means that long term would be 60-minute chart and medium term would be 15-minute chart and short term would be 15-minute chart. Inter time frame analysis help you focus on trading with trend.
(The author is a homemaker who dabbles in stock market investments in free time)


