Market consolidation continues

Market consolidation continues
Bulls turning cautious for last 6 weeks
The stock market declined for the second consecutive week and closed at four week low. The Nifty lost 236.70 points or 1.61 per cent. The BSE sensex also lost 1.7 per cent. The broader indices Nifty midcap-10 fell by 0.9 per cent and the smallcap-100 index down by 2.7 per cent. Nifty Pharma up by 2.5 per cent, and the metal index advanced 0.6 per cent. All other sectoral indices ended up with losses. The Bank Nifty, Auto and Energy indices were down by 2.5 per cent 4 per cent respectively. The advance-decline ratios were negative during the week. FIIs sold Rs 6,280.85 crores during the week. The DIIs bought Rs 4,596.64 crores.
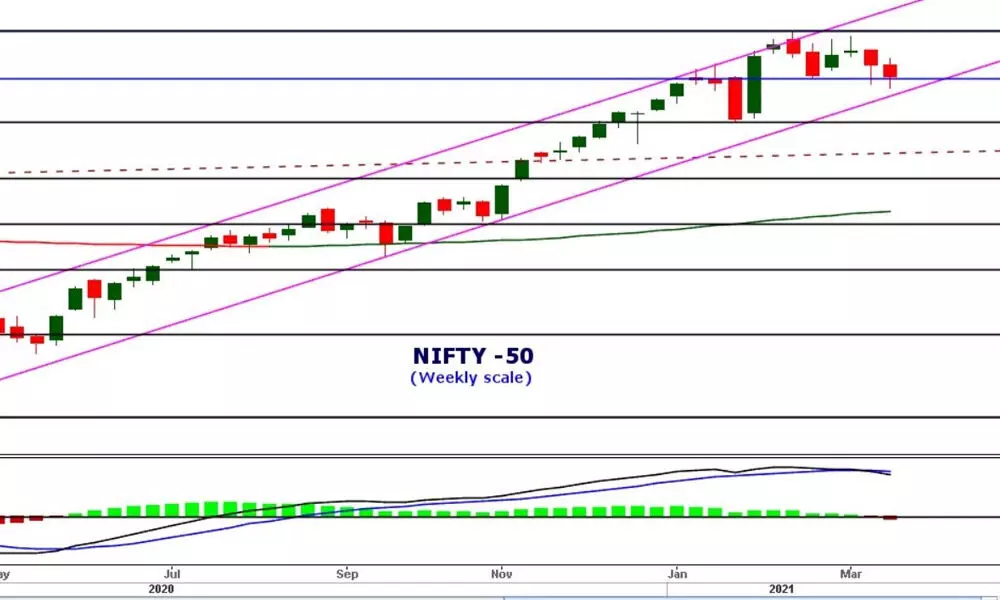
The Indian stock market consolidation continues for the sixth week. Like any other consolidation, the current is also not giving any clues about the future moves as it formed at the lifetime highs. The consolidation between 15,431-14,467 has resulted after a sharp budget rally of 1,835 points. Interestingly, the Nifty tested the 50 per cent retracement level twice during the one last month and closed just below to at the end of the week. It also tested the 61.8 per cent retracement on Thursday. And it has oscillated around 50DMA, and finally, it closed 1.74 per cent below to it.
The daily chart pattern looks like a double top, as it formed two lower highs and a valley point. The valley point breached on March 19th on an intraday basis, and closed below on March 25th, but able to close above the valley point at the end of the week.
The Nifty is moving in an upward channel since March 2020 levels. In any case, the Nifty closes below the 14,264 may result in a channel breakdown, which will confirm the major top formed at 15,431 on February 16th. In fact, the Bank Nifty, which is one of the driving force of the Mar-Feb rally. Two days to go, the Nifty forming a shooting star candle on a monthly chart. Three shooting stars in a row on a monthly chart is a significant sign of topping formation. Currently, the Nifty has six distribution days. Any addition of distribution days and a breach of prior low will change the market status to the downtrend.
Two different classical patterns, one is bearish (double top), the other one is bullish (bull flag), are giving confusing signals. Both patterns witnessed a breakdown and retested. Unless either pattern breakout happens, when the consolidation ends, we can expect violent moves.
On the indicators front, there is nothing much to discuss. The RSI (60.39) has closed below the two prior lows and earlier resistance on the same weekly chart. It actually broke the descending triangle. The main driving force for the market is FII inflows. An aggressive buying in the last five months has significantly slowed down. After pumping Rs 1,79,104 crores in just five months at an average of almost Rs 36,000 crore.
The current PE is at 39.51 and touched 41.78 on February 16th 2021. The Price to Book Value (PBV) does not take the earnings into account as a parameter. The PBV of 4.34 (February 16th) is at 12 years high. On Friday close it was at 4.11.
The bulls are turning cautious for the last six weeks. The Nifty must break either 15,100-330 level and register a bullish flag breakout to continue the uptrend. It should break down the double bottom pattern by closing below the recent two swing lows of 14,460-264 to signal a significant correction of 20 per cent from the current top. In consolidation, we may not get a well-qualified trade.
(The author is a financial journalist and technical analyst. He can be reached at [email protected])


