Live
- Sri Lanka concludes sovereign bond restructuring
- Lal Krishna Advani hospitalised at Delhi's Apollo Hospital
- Modi performs puja at Triveni
- Jammu records season’s lowest minimum temperature as Kashmir valley shivers
- Scheme to give Rs 1K to women to be rolled out in 15 days
- Flirty Texts That Turn into Dates
- ‘Asli’ Sonakshi shares a glimpse of herself in ‘golden hour’
- Shraddha Kapoor took ‘thepla’ for her ‘foreign’ trip
- ChatGPT Now Supports Video Inputs: All Details
- B.Com vs BBA: Which degree better prepares you for an MBA?
Just In
Market trading in overvalued zone


Market trading in overvalued zone
The Indian stock market bounced with the union Budget and rallied above 15,000 levels during the week
The Indian stock market bounced with the union Budget and rallied above 15,000 levels during the week. It is one of the most positive closing weeks in the past decade and registered a second highest Budget day gain. The market has a tremendous weekly gain. For all the five sessions, it closed positively. The Nifty was up by 1,290 points or 9.46 per cent during the week. BSE Sensex gained by 9.6 per cent. On the sectoral front, the PSU Bank index is the top gainer with a whopping 25 per cent. The BankNifty and FinNifty advanced by 15 per cent each. Auto, metal and realty indices were up by 10-14 per cent during the week. The broader indices Nifty Midcap-100 and Smallcap-100 were up by 7.3 per cent and 6.4 per cent respectively. After a one-week pause, the FIIs bought Rs 13,595.16 crore worth of equities during the week. The DIIs slowed down the selling. They sold just Rs 4712.60 crore. The advance-decline ratio is positive during the week.
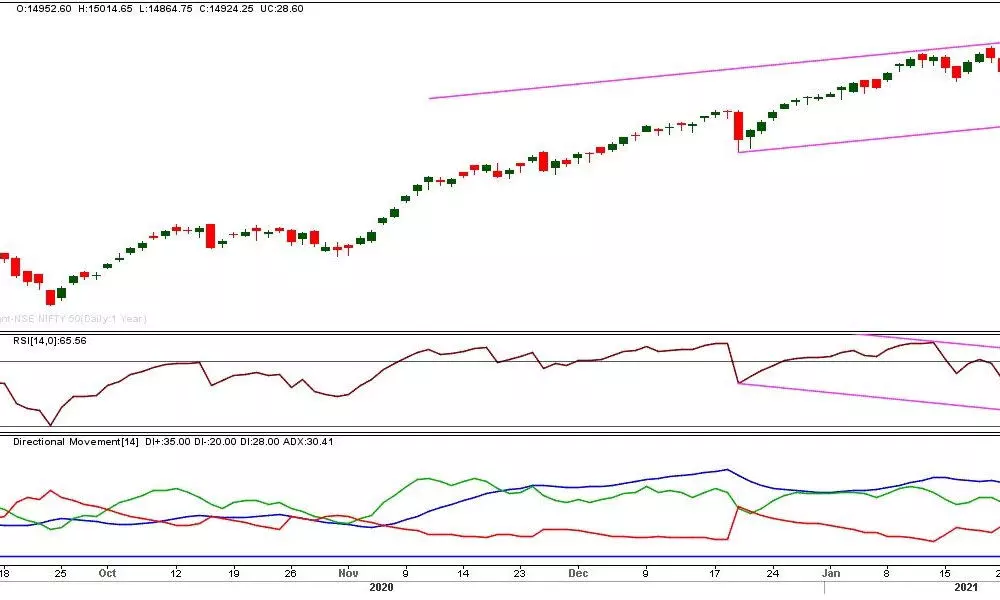
The Nifty rose by 99.89 per cent (doubled) from the March low. It is important to keep in mind that we are trading in the overextended and overvalued zone. It is obvious that the market tops are formed when the optimism is high. The current market condition is no exception to that. But, we need to have technical evidence to suspect any top in place or not.
On the front of the indicator, nothing is negative on daily or weekly charts. The MACD is showing the bullish momentum on the daily and weekly chart. But the Directional movement indicators are showing a different picture. On 29th January the ADX is 35.23. After this date, the Nifty rose by 10 per cent. But, the trend strength indicator was down to 30.41. Does it mean trend strength weaken? On a weekly chart, it is flat at 27.70. This is the first caution for not to be aggressively bullish. The second point of interest is that the RSI is moving in a downward channel, and the price is moving higher. With 10 per cent correction previous week, the indicators came out from an overbought condition. In this process, the indicator made a new low, which is divergent from the price. One way this is indicating these divergences hinting some probable negative outcomes in the near future. These all only caution, not the confirmations.
In 1992, it was an Old Economy bubble based on asset valuations. When it was bust, the old economy stocks like Tisco, Tata motors and ACC fell by 90 per cent. In 2000, it was a new economy bubble base on Y2K or Dot bubble or IT bubble. The bubble bust as 90 per cent fall in then the benchmark for the sector, BSE IT index fell sharply by 90 per cent. In 2008, it was Real Estate or Construction bubble when it busts the BSE Reality index also lost by 90 per cent. If the current scenario believes that the ownership is changing towards foreign hands, as the domestic institutions are selling at a record level. The latest data needs to check on this front. In a majority of Nifty-500 stocks dominated by FII holdings. For the last five weeks, the Dollar index up by 2.7 per cent. Any further bounce will lead to profit booking by the FIIs. In such a case, coincides with a weekly price confirmation, the current market may lead to a Foreign Investment bubble. Watch the FII figures for the next two months.
The 50DMA also stands there as major support. Before that, there is major support, the gap area of 2nd February 14336- 14469 zone will act as a critical support for the near term. Keep in mind these levels. Any breakdown below these levels will lead another down leg. For the short term trades, a close below the prior day low is a weak signal. Ride the uptrend as long as the Nifty is making higher highs on a daily chart.
(The author is a financial journalist and technical analyst. He can be reached at [email protected])

© 2024 Hyderabad Media House Limited/The Hans India. All rights reserved. Powered by hocalwire.com


