Markets in consolidation mode

Markets in consolidation mode
Indian stock market witnesses mostly range-bound trading last week. BSE Sensex gained by 0.6 per cent while broader indices outperformed the benchmarks.
Indian stock market witnesses mostly range-bound trading last week. BSE Sensex gained by 0.6 per cent while broader indices outperformed the benchmarks. The Nifty Midcap-100 and Smallcap-100 were up by 3.9 per cent and 6.3 per cent respectively. The overall market breadth is also in favour of advances.
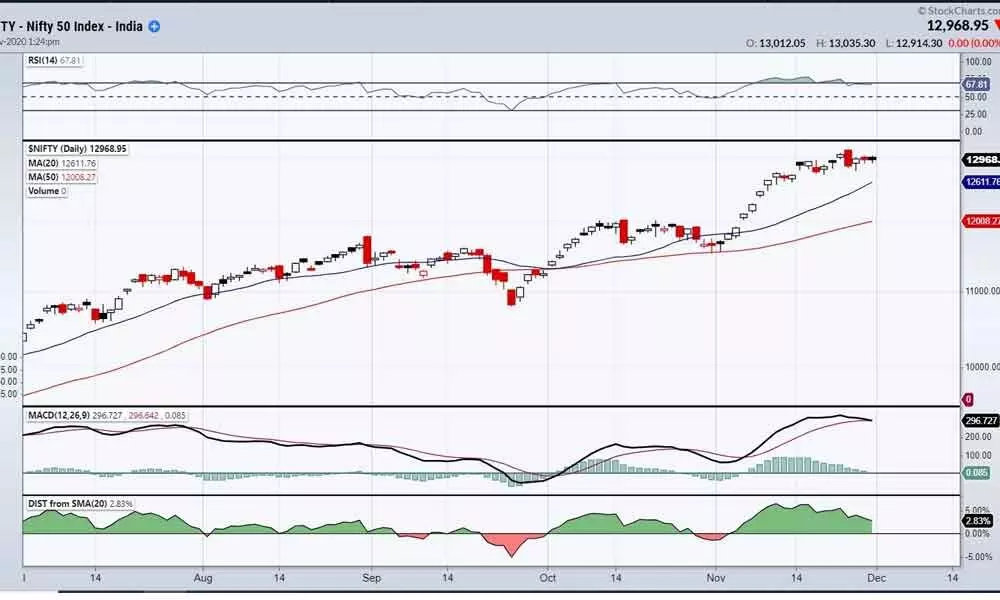
Nifty formed a long-legged doji candle as it closed where it opened last week. Generally, the rule is that doji at lifetime highs are little different from the doji at normal swing highs. Lifetime doji requires a bearish confirmation by closing below it next week. Any Doji candle is a sign of indecisiveness in the market. Before resuming or reversing the prior trend, it forms at a swing high. In any case, if it opens and closes above the doji close, the trend may continue in that direction. For the past ten days, the Nifty is trading within the 360 points range with increased volatility. At lifetime highs, increased volatility and range bound trade are signs of distribution. At the same time, the momentum is clearly on the downside.
All the indicators are coming out of an overbought condition. There is a negative divergence on RSI, and it formed lower tops and lower bottoms, showing divergence. Currently, Nifty is trading 2.83 per cent above the 20DMA. As we mentioned earlier, whenever it moves above 6 - 7 per cent above the 20 DMA, the index tries to come down to the mean (20DMA) level. On November 11, the benchmark index moved 6.56 per cent above the 20DMA. Since then, it is coming down, and the Bollinger bands started contracting. This is an indication of consolidation on the cards. The consolidation may be in the range of recent high 13145-12600 zone. Either side breakout will result into a strong trend on the side it broke. The short term support placed at 12765, is a 23.6 per cent retracement level of prior swing. Either breaking this support or the RSI moving below 60 levels means, the market entered into a counter-trend. In this case, it may form a flag or a pennant. In any case, it prolongs the consolidation period, and then it may form a triangle or a channel. The MACD histogram is on the zero line, and any close below it may result in a bearish signal. The positive directional movement indicator +DMI is declining like the RSI and showing weakening strength. The trend strength indicator, ADX is also declining from 40 levels to 38.82, which is also a sign of trend exhaustion.
The Elder's impulse system is suggesting that the market entered into a neutral zone. Interestingly, even though the indicators are suggesting exhaustion in the trend, the volume trend is differing. The cash volumes reached to at a record level in the history. The Nifty cash volume is above the average level and above the June level. This trend is confusing as these volumes may be an accumulation or a distribution.
Fundamentally, we are trading at a 35.66 price-earning (PE) ratio. It indicates the stretched valuations, but, it has become a neo-normal across the markets. Even though GDP is still in the contraction, the markets are discounting the future earnings. If earnings growth do not match the expectations in the current quarter; it may lead to a price correction.
Though, the market has not given any reversal signals, we need to be prudent and cautious while adding the fresh positions as the Nifty is trading over 20 per cent above the long term trend indicator 200DMA, which is very rare. Expect some pullback in the market. I suggest booking some partial profits of existing positions.
(The author is a financial
journalist and technical analyst.
He can be reached at [email protected])


