LS candidates jump 4-fold between 1952 and 2019
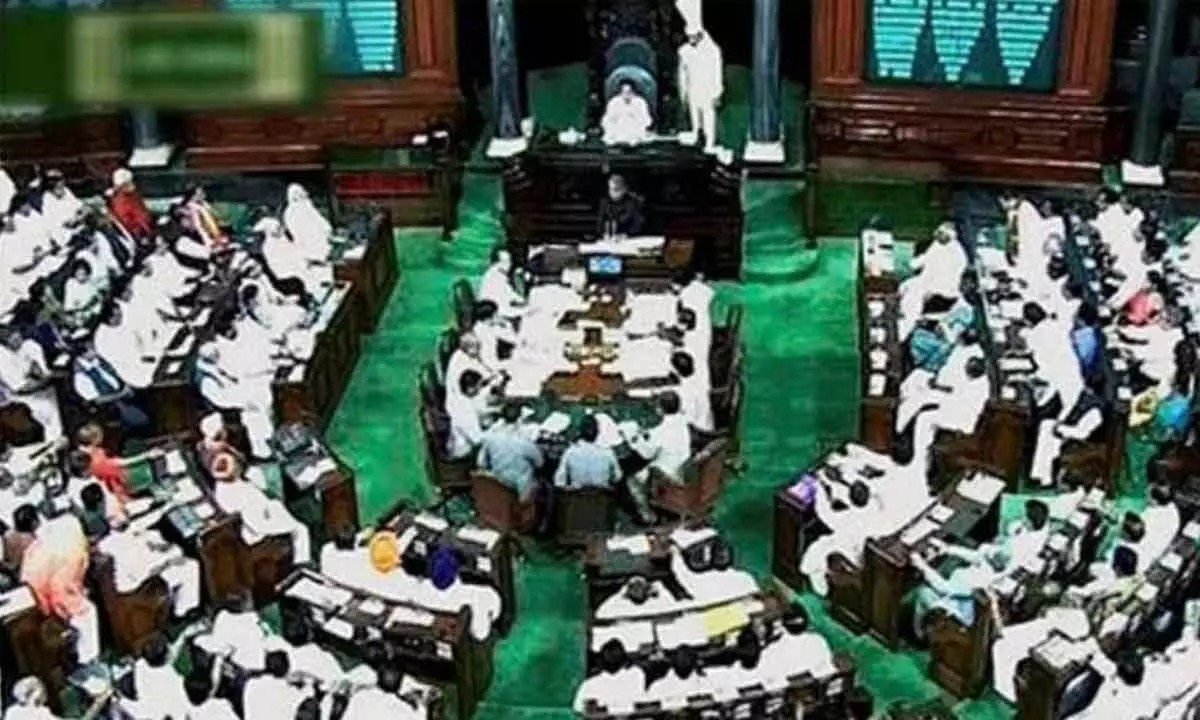
New Delhi: The number of candidates contesting the Lok Sabha polls has seen a rise of over four times from 1,874 in 1952 to 8,039 in 2019, according to official data. The average number of candidates per constituency has jumped from 4.67 to 14.8 in the same period, the data showed.
With the Lok Sabha polls nearing, the battleground is set but it is yet to be seen how many candidates are in the fray even as the proportion of candidates contesting has seen a rise since 1952 when the first elections were held. On an average, there used to be only around three to five contestants per Lok Sabha seat until the sixth Lok Sabha elections in 1977.
However in the last elections 14.8 candidates on average contested from per constituency across the country.
According to an analysis by non-profit organisation PRS Legislative Research, there were 8,039 candidates contesting from 542 Parliamentary constituency seats in the 2019 general assembly elections. A closer look at the last Lok Sabha polls in 2019 show that on an average, among all the states, Telangana had the highest average number of candidates contesting. This is primarily due to 185 contestants from Nizamabad. Excluding Nizamabad, the state’s average number of contestants would be 16.1.
After Telangana, Tamil Nadu had the highest average of independent candidates contesting in last election. Of the candidates in each constituency in Tamil Nadu, an average of two-thirds contested as independent candidates. After Nizamabad, the second highest number of candidate representation was seen in Belgaum, Karnataka. The five constituencies that had the highest candidate representation were from the southern states of Telangana, Karnataka, and Tamil Nadu.
The Bharatiya Janata Party and Congress contested 435 and 420 seats respectively. They were in competition with each other in 373 seats. BSP fielded the third highest number of candidates contesting in the 2019 elections. The seven national parties together fielded 2.69 candidates per constituency.
Among the largest five states, West Bengal had the highest representation of candidates from national parties at 4.6 and had candidates from five national parties contesting in the state. Recognised state parties together fielded 1.53 candidates per constituency. Bihar (6 state parties) and Tamil Nadu (8 state parties) saw a high representation of candidates from state parties at 1.2 and 1.3 respectively.
Five states have more than 30 Parliamentary constituency seats: Uttar Pradesh (80), Maharashtra (48), West Bengal (42), Bihar (40), and Tamil Nadu (39). These states together have 249 seats i.e., 46 per cent of Lok Sabha. There has been a marked increase in the total number of candidates contesting the elections over the years.
According to official data, while in 1952 there were 1,874 candidates for 489 seats, giving an average of 3.83 candidates per constituency while the number steadily increased to 2,784 candidates in 1971 giving an average of 5.37 candidates per constituency. In 1977, 2,439 candidates contested and average candidates per constituency stood at 4.5, the data showed.
The 1980 elections saw an increase in the number of candidates to 4,629, giving an average of 8.54. In 1984-85, the eighth general elections had 5,492 contestants, with an average of 10.13 per constituency. The ninth general elections in 1989 had 6,160 candidates in the fray, with an average of 11.34 candidates, while in the 10th Lok Sabha elections in 1991-92, 8,668 candidates contested for 543 seats, giving an average of 15.96 per constituency.
In the 11th general assembly elections, the average of per seat contestants recorded a sudden hike in average with 25.69 candidates per seat indicated an abnormal shift. There were a record number of 13,952 candidates in fray for 543 Lok Sabha seats, bringing the average of per seat contestants to 25.69 from 16.38 in the previous elections in 1991.
The Election Commission of India hiked the amount of the security deposit from a mere Rs 500 to Rs 10,000 which apparently, helped in bringing down the number of contestants per seat to 8.75 candidates in 1998 Lok Sabha elections when after a long gap, the total number of contestants was less than 5,000 -- 4,750 to be precise.
The number of candidates only rose marginally in 1999 general elections to 4,648, averaging 8.56 contestants per seat. In 2004, the figure of total contestants again crossed the 5000-mark with 5,435 contestants in the fray for the same number of 543 Lok Sabha seats, averaging just over 10 contestants per seat.
In the 2009 general elections, a total of 8,070 candidates contested for 543 Lok Sabha seats, therefore the average rose sharply to 14.86, the official data showed. A total of 8,251 candidates were in the fray in the 2014 Lok Sabha polls.


