Inflation In India

India is the tenth largest economy in the world and the second most populous Country. The most important and the fastest growing sector of Indian economy are services. It contribute more than 60 percent of GDP.
India is the tenth largest economy in the world and the second most populous Country. The most important and the fastest growing sector of Indian economy are services. It contribute more than 60 percent of GDP.
.jpg)
In India, interest rate decisions are taken by the Reserve Bank of India's Central Board of Directors. On September 29th, 2015 The Reserve Bank of India cut its benchmark repo rate 50 bps to 6.75 percent from 7.25% in the month of August 4th2015. It is the fourth reduction in year 2015-16, bringing the rate to the lowest since April of 2011, as policymakers tried to boost the Indian Economy. Interest Rate in India averaged 6.71 percent from 2000 until 2015, reaching an all-time high of 14.50 percent in August of 2000 and a record low of 4.25 percent in April of 2009.
Inflation is dynamic nature in Indian Economy due to money supply, Government Actions and Estimation, Demand and supply of Products and Services and Indian market and environment. India have an agrarian society, so it definitely facing droughts, floods due to bad monsoon conditions and also inadequate infrastructure facility in the Primary Sector including storage hindrances.
The word "inflation" strikes fear into the hearts of many Indians. It indicates rising commodities prices, falling Rupee and an income that just can't keep up with the cost of living in the society.
Inflation means a sustained increase in the price level of products and service in the Economy. The main causes of inflation are either demand factor or supply side factor (cost push factor).Generally inflation is due to Demand and supply of the products and Service in the society. In addition to consumer spending power and attitude and behaviour of society in the Indian Economy condition including Indian Financial System. Confidence in the Economy.
When you get an experience of consistent Price raise of product or service that is inflation, that may be due to more money is being circulated less supply and more demand of available commodities.
An average Inflation rate in India 8.23% from 2012 until 2015. During November 2013 Inflation rate recorded 11.26%. But at present that is on August 2015 a low inflation rate inflation recorded that is 3.02% as per the Ministry of Statistics and Programme Implementation (MOSPI), India. (On point to point basis i.e. August, 2015 over August 2014).
Inflation is defined as increase in the general level of prices for goods or commodities and services. In other words inflation is just price raise of Goods and services. Either Demand increase with the same level of supply or the Supply increases with the same level of Demand. If Factor inputs like Land and Labour will push up leads to increase the Production cost and effects the inflation.
Mainly Inflation will be decided by the Factor of Production, Indian fiscal policy, and quarterly Monitory policy, Government Actions and, Internal and external Environment factors.
Generally inflation redistributes wealth from Creditors to Debtors. During inflation period Lender suffers and borrowers benefits. If inflation falls the common man may not be benefitted and Debtors will loss and Creditors will be benefitted because of Money will strengthen.
Too much money chases just few goods. It basically occurs in a situation when the aggregate demand in the economy has exceeded the aggregate supply. For example A Country has a capacity of producing just 1000 units of a commodity and Service but the actual demand in the country is 1500 units of commodities and service in the particular period.
Hence as a result of too much money chases just few goods that is to say scarcity in supply the prices of the commodity rises. That may considered as High Demand and Low supply.
The consumer or common man desire and purchasing power of a products and services will lead to Inflation is subject to same level of Production or output.
India should fulfil the need and wants of the people and particularly the basic needs and wants of the people. It should be fulfilled by producing of goods or commodities and service with the support of Production factors like Men, Material, Money and Machinery, Indian Financial system Government support. This will be possible only effective policy formulation and effective use of available resources.
During inflation time it is recommend and suggested that to expand production level by using efficient Technology and Effective Monitory policy.
The Central Statistics Office (CSO), Ministry of Statistics and Programme Implementation has revised the Base Year of the Consumer Price Index (CPI) from 2010=100 to 2012=100 with effect from the release of indices for the month of January 2015.
Ministry Of Statistics and Programme Implementation Central Statistics Office Has Published Inflation Rates On Dated The 14th September 2015. The CPI (Rural, Urban, and Combined) on Base 2012=100 is being released for the month of August 2015. In addition to this, Consumer Food Price Index (CFPI) for all India Rural, Urban and Combined are also being released for August 2015. Inflation rates (on point to point basis i.e. August, 2015 over August 2014), based on General Indices and CFPIs are given as follows:
Inflation in India:
.jpg)
The above indices clearly says that India Inflation Rate Falls to Fresh Record Low
The Indices and inflation rate have been presented periodically at All India level, State/UT wise for Rural, Urban and Combined.
Inflation Rate in India is reported by the Ministry of Statistics and Programme Implementation (MOSPI), India. Consumer prices in India increased 3.66% year-on-year in August of 2015, the inflation rate fell to a fresh record low in August 2015. Inflation staying below the central bank’s 6% target. Inflation Rate in India averaged 8.22 percent from 2012 until 2015, reaching an all-time high of 11.16 percent in November of 2013 and a record low of 3.66 percent in August of 2015.
In India the handling of inflation is a careful combination of effort of Apex bank in India (RBI) and Government of India action on Fiscal Policy by the Ministry of Finance with the Inter ministry Group on inflation. The primary objective of the RBI monetary policy became price stability, giving less importance to government's borrowing, the stability of the rupee exchange rate and the need to protect exports.
Measuring Inflation: Inflation is a measure of changes in the cost of living of the People. The measurement of inflation is how consumers’ purchasing power is affected by rising prices. It will hep for Effective financial Administration.
In the Indian Economy whole sale price index inflation used for macro level analysis and Consumer Price Index inflation will be used for Micro level analysis.
1. Whole Sale Price index.
2. Consumer Price Index.
1. WHOLE SALE PRICE INDEX.
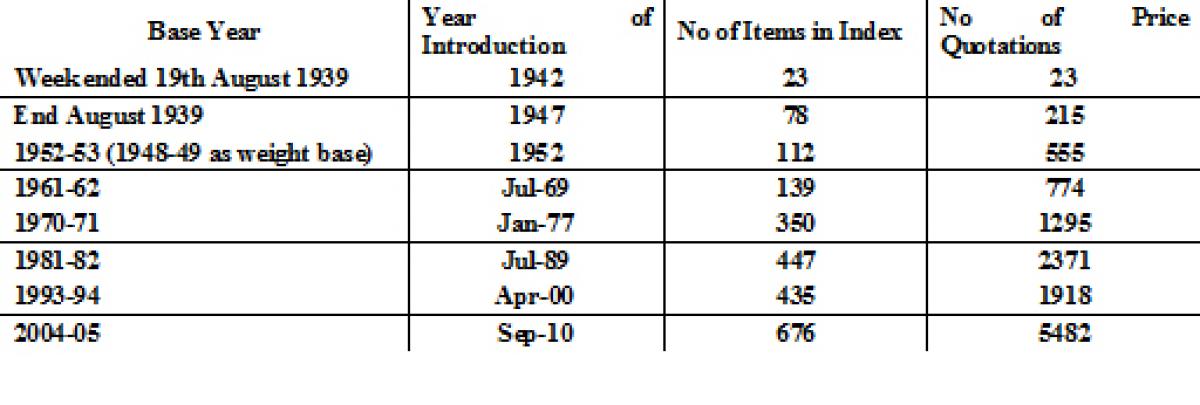
In India, the wholesale price index (WPI) is the main measure of inflation. The WPI measures the price of a representative basket of wholesale goods. The Government look for WPI data for measurement of Inflation. The First index number of Whole sale price commenced in the year 1942 in India with (Base year: 1939-05=100), which was published by the O/o The Economic Adviser to the Government of India (Ministry of Industry). At present Inflation is measuring with base year 2004-05=100).
Mainly the Government will look for WPI Data for measurement of inflation.
The Wholesale Price Index (WPI) is the price of a representative basket of wholesale goods. The official Wholesale Price Index for ‘All Commodities’ (Base: 2004-05=100). The WPI based inflation (provisional) dropped further to -4.95% in August 2015 from -4.05 in July 2015 influenced by global deflationary trend in commodity prices.
The annual rate of inflation, based on monthly WPI, stood at -4.05% (provisional) for the month of July, 2015 (over July, 2014) as compared to -2.40% (provisional) for the previous month and 5.41% during the corresponding month of the previous year. Build up inflation rate in the financial year so far was 0.80% compared to a build-up rate of 2.61% in the corresponding period of the previous year. Cost of manufactured products and diesel declined in August 2015 as compared to more than in July 2015 and The WPI has been in the negative territory since November 2014.
The historical development of this WPI is showing the below table.

INDEX OF EIGHT CORE INDUSTRIES (BASE: 2004-05=100):
The summary of the Index of Eight Core Industries (base: 2004-05)
The Eight Core Industries comprise nearly 38 % of the weight of items included in the Index of Industrial Production (IIP). The combined Index of Eight Core Industries stands at 169.6 in August, 2015, which was 2.6 % higher compared to the index of August, 2014. Its cumulative growth during April to August, 2015-16 was 2.2 %.
1. Coal
Coal production (weight: 4.38 %) increased by 0.4 % in August, 2015 over August, 2014. Its cumulative index during April to August, 2015-16 increased by 4.6 % over corresponding period of previous year.
2. Crude Oil
Crude Oil production (weight: 5.22 %) increased by 5.6 % in August, 2015 over August, 2014. Its cumulative index during April to August, 2015-16 increased by 0.5 % over the corresponding period of previous year.
3. Natural Gas
The Natural Gas production (weight: 1.71 %) increased by 3.7 % in August, 2015. Its cumulative index during April to August, 2015-16 declined by 2.7 % over the corresponding period of previous year.
4. Refinery Products (93% of Crude Throughput)
Petroleum Refinery production (weight: 5.94%) increased by 5.8 % in August, 2015. Its cumulative index during April to August, 2015-16 increased by 4.3 % over the corresponding period of previous year.
5. Fertilizers
Fertilizer production (weight: 1.25%) increased by 12.6 % in August, 2015. Its cumulative index during April to August, 2015-16 increased by 5.9 % over the corresponding period of previous year.
6. Steel (Alloy + Non-Alloy)
Steel production (weight: 6.68%) declined by 5.9 % in August, 2015. Its cumulative index during April to August, 2015-16 declined by 0.03 % over the corresponding period of previous year.
7. Cement
Cement production (weight: 2.41%) increased by 5.4 % in August, 2015. Its cumulative index during April to August, 2015-16 increased by 1.8 % over the corresponding period of previous year.
8. Electricity
Electricity generation (weight: 10.32%) increased by 5.6 % in August, 2015. Its cumulative index during April to August, 2015-16 increased by 2.8 % over the corresponding period of previous year.
2. CONSUMER PRICE INDEX.(BASE 2012=100)for Rural, Urban and Combined For the Month of August 2015. Generally RBI Looks Consumer Price Index for Policy decision making in Indian Financial system. The Central Statistical Organisation (CSO), Ministry of Statistics and Programme Implementation, compiles and publishes regularly the monthly Consumer Price Index for Urban Non-Manual Employees [CPI (UNME)]. The CSO has been compiling CPI (UNME) since 1960. The index measures the overall changes in the level of average retail prices of goods and services consumed by the target population.
The earlier CPI (UNME) series, with 1960 as base year, had as its source of weights, results of a middle class family living survey, conducted by CSO in 1958-59 in 45 selected urban centres. The survey basically covered urban families who derived major portion of their income from non-manual occupations in the non-agricultural sector.
The base year of the current CPI (UNME) series is 1984-85. The source of weights for this series is a family living survey that was conducted during 1982-83 in 59 selected urban centres, which included the 45 centres covered earlier. The sample survey basically covered families of urban non-manual employees, who by definition, derived 50 percent or more of their income from gainful employment on occupations of one or more of its members doing non-manual work in the non-agricultural sector. A market survey, covering all the selected centres, was also conducted during 1983. Using the amended weights, and results of the market survey, the revised CPI (UNME) series, with 1984-85 base, is being compiled and released every month since November 1987.
Next Story


