Delhi Economic Survey finds Capital's air quality worse

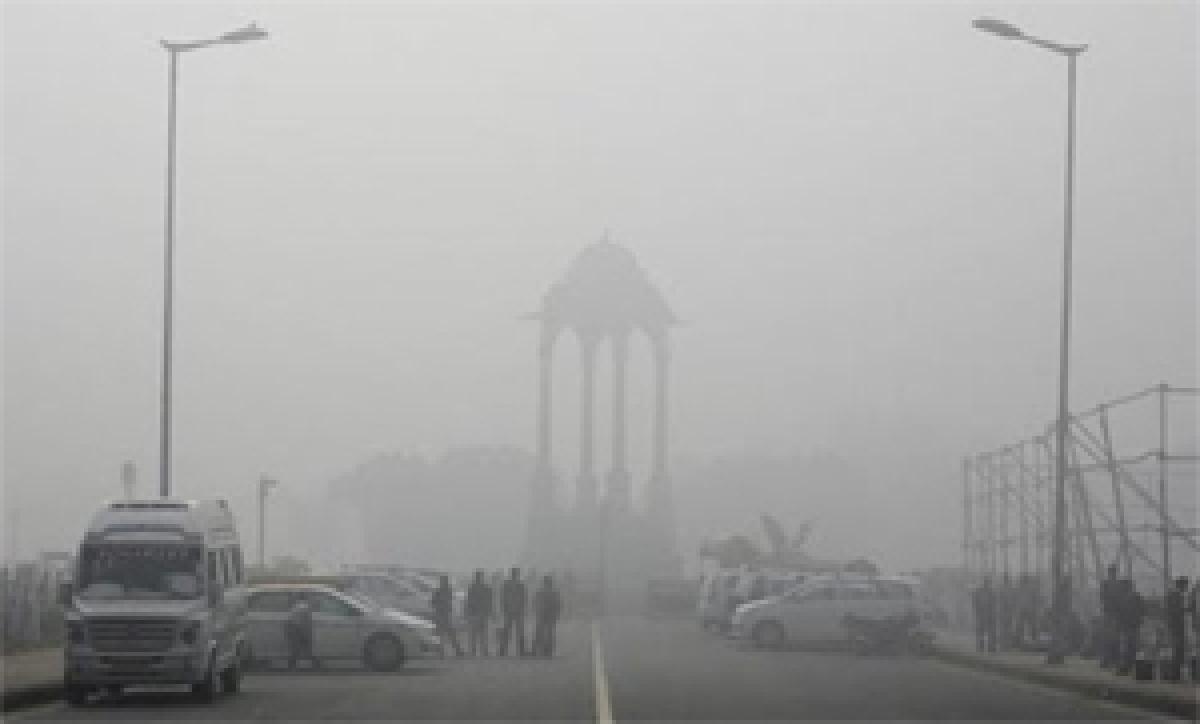
Delhi Economic Survey Finds Capital\'s Air Quality Worse. The air quality in Delhi has worsened considerably in past few years, according to the Economic Survey of Delhi 2014-15 released on Wednesday.
.jpg) New Delhi: The air quality in Delhi has worsened considerably in past few years, according to the Economic Survey of Delhi 2014-15 released on Wednesday
New Delhi: The air quality in Delhi has worsened considerably in past few years, according to the Economic Survey of Delhi 2014-15 released on Wednesday
The PM10 - particulate matter or the mixture of extremely small particles and liquid droplets like acids, chemicals, gas, water, metals, soil dust particles, whose concentration defines the level of pollution in a city -levels rose from 282 microgrammes per cubic metre (mcg/m3) in 2013 to 318 mcg/m3 in 2014 while the standard level was 60 mcg/m3, the survey said.
The PM10 level in 2010, 2011 and 2012 was 249, 281, and 293 mcg/m3 respectively.
The survey report said that the city suffers from air pollution caused by transportation, road dust, industries and domestic air emissions.
The Delhi Pollution Control Committee presently monitors air quality through six online continuous ambient air quality monitoring stations at six locations - R.K. Puram, Mandir Marg, Punjabi Bagh, I.G.I Airport, Anand Vihar and Civil Lines.
The concentration of PM 2.5 varied from 125 mcg/m3 to 191 mcg/m3 over the last year as opposed to the annual standard of 40 mcg/m3. The minimum was observed at Mandir Marg and maximum at Anand Vihar, the survey revealed.
According to survey report, nitrogen dioxide (NO2) concentration has shown a marginal increase as compared to 2011, while the highest annual average was observed in 2012 (118.2 mcg/m3). In 2014, the average value was 79 mcg/m3.
The minimum value was observed at R.K. Puram and maximum at Punjabi Bagh and the higher values may be due to high vehicular density in the area, the survey said. At all the monitoring locations, annual average exceeded the prescribed standard of 40 mcg/m3.
The levels of carbon monoxide in 2014 varied from 1.28 mcg/ m3 to 2.64 mcg/m3 . The minimum was observed at Mandir Marg and maximum at Civil Lines. Except the latter, at all other locations, CO is under the prescribed standard of 2 mcg/m3.
The report also states that besides human and environmental damage, pollution has caused economic damage as well. The report held vehicular pollution as the main source of air pollution in Delhi.
It is estimated that air pollution generated from industrial activity in Delhi is about 20 percent of total air pollution, report said.


