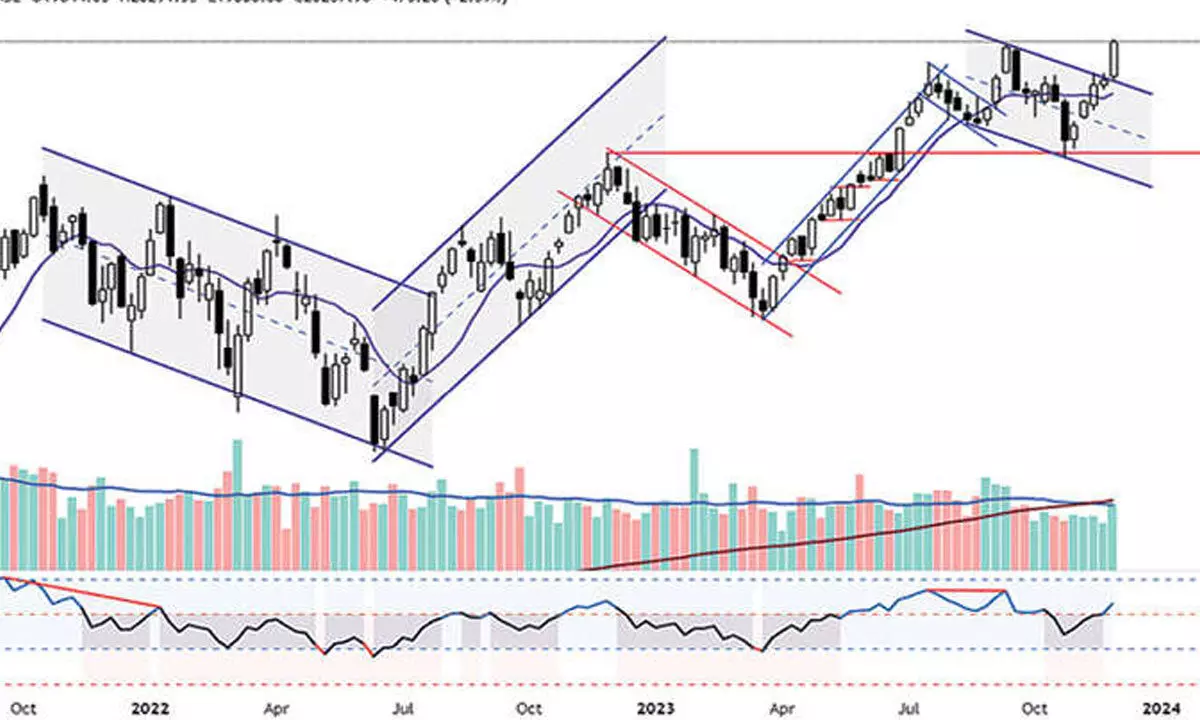
Charts indicate bullish flag pattern breakout

For the last truncated week, the domestic market was strongly bullish in all four sessions.
For the last truncated week, the domestic market was strongly bullish in all four sessions. Last week, NSE Nifty gained by 473.20 points or 2.39 per cent. BSE Sensex is also up by 2.3 per cent. The broader market indices continue to outperform the benchmark indices. The Nifty Mid-cap and Small-cap indices are up by 3.2 per cent and three per cent, respectively. All the sectoral indices closed positively. The Bank Nifty, Auto, FinNifty, FMCG, Metal and Realty indices were up by 1.5-2.5 per cent. After three months of selling, FIIs turned buyers in November month, as they were net buyers in the last six days. Overall, they bought Rs5,795.05 crore, and the DIIs bought Rs12,762.14 crore in November month.
The Nifty has formed a new lifetime high with the strongest bullish bar. It gained by 2.39 per cent, the highest after June last week. After 11 weeks, the volume was recorded above average. During the previous four weeks of the current rally, the volume was lower and declining, misguided the traders. After completing the throwback by testing the November 2022 high, the index bounced as expected. But the bounce is more than expected. The Nifty rallied by 1,454 points or 7.72 per cent. It is 3.35 per cent above the 20-weekly average and closed above the weekly Bollinger band, which indicates an over-stretched market condition.
The Nifty is in uncharted territory with no distribution day count. This is an indication of a strong bullish trend. Currently, it’s 7.71 per cent above the 200DMA. It formed a new high at 2023, which was 9.45 per cent above the 200DMA. The 10, 30, and 40-week averages are in an uptrend, in descending order, which is also a strong trend indicator. Importantly, the Nifty has had a higher relative strength and momentum recently and is in the leading quadrant in RRG charts.
The price pattern looks like a bullish flag pattern breakout with a high volume. The pattern target is at 22,000 points. But the immediate target and resistance is at 20,420 points, which is a 50 per cent extension level of the prior upswing. On the downside, a close below the prior day’s low (20,183) will give a first sign of weakness. A close below the 8EMA (19,983) will lead to counter-trend consolidation. This pullback must not close below the 19,800-736 zone. If it closes below this zone, we will see bearish divergences in RSI, which, in turn, will lead to a profit booking.
(The author is Chief Mentor, Indus School of Technical Analysis, Financial Journalist, Technical Analyst, Trainer and Family Fund Manager)


