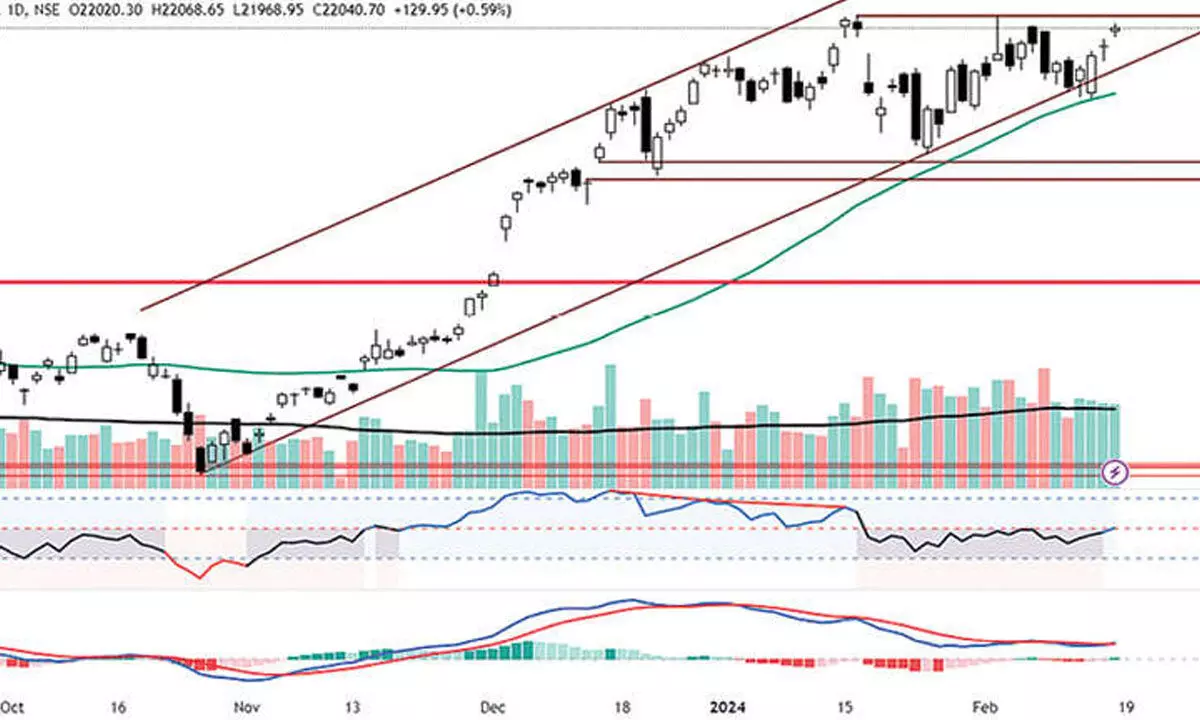
Charts indicate undercurrent bullish bias

Except for the Monday session, NSE Nifty found the positive momentum and closed higher by 258.20 points or 1.19 per cent
Except for the Monday session, NSE Nifty found the positive momentum and closed higher by 258.20 points or 1.19 per cent. The BSE Sensex also closed with a 1.19 per cent gain. The Midcap-100 is up by 0.50, and the Smallcap-100 is down by 0.46 per cent. The Nifty Auto is the top gainer with 4.33 per cent, followed by the PSU Bank index with 2.74 per cent. On the flip side, the Nifty Metal index declined by 1.47 per cent, and Media went down by 1.23 per cent. The FIIs sold Rs13,917.89 crore, and the DIIs bought Rs17,939.01 crore worth of equities. The India VIX is down by 1.46 per cent to 15.22. Overall, market breadth is positive.
The Nifty has registered the highest weekly close and is just 86 points away from an all-time high. It also closed at the highest level after January 15. Last week, the Index was powered by banks and auto stocks. Bears dominated on Monday, but failed to pull down the index below 50 DMA.
For the last four weeks, the 10-week average acted as solid support. Out of the last five weeks, volumes were above average for four weeks. During the last week, volumes were lower than in the previous two weeks. The index is closer to the top end of the 21,137-22,128 broad range.
By closing above the 22,000 level, the Nifty has filled the 15th January gap on a closing basis. Before this, it attempted at least seven times. The current price pattern is an ascending triangle within the broad rising channel. The 23-day ascending triangle breakout pivot is at a prior high of 22,127 points. In any case, the index registers a breakout with huge volume; the immediate target is 22,236 points. It may retest the breakout points; otherwise, the pattern target is around a thousand points from the breakout level, which is around 23,100 points. Interestingly, the Bollinger bands moved horizontally during the pattern formation without any squeeze. If they expand, expect the index to move higher. In any case, they contract, the consolidation will extend with the sideway moves.
The most positive aspect of the price pattern is that before the pattern breakout, the RSI shifted its range into the strong bullish zone by moving above 60. Usually, a breakout with an RSI range shift is the most powerful. The MACD also gave a fresh, bullish signal.
(The author is Chief Mentor, Indus School of Technical Analysis, Financial Journalist, Technical Analyst, Trainer and Family Fund Manager)


