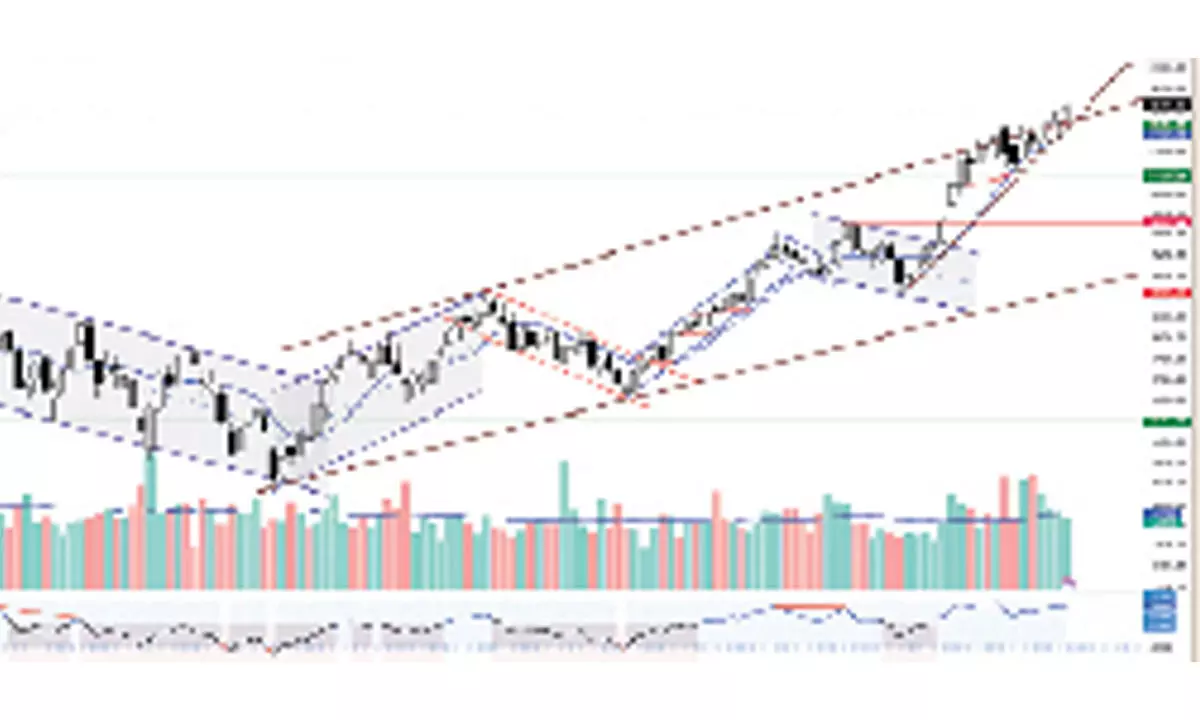
Daily MACD histogram signals dull momentum

The equities continue to have positive momentum and hit new highs last week. NSE Nifty gained 115.15 points or 0.51 per cent. The BSE Sensex is up by 0.51 per cent.
The equities continue to have positive momentum and hit new highs last week. NSE Nifty gained 115.15 points or 0.51 per cent. The BSE Sensex is up by 0.51 per cent. The broader market indices lost momentum. The Nifty Mid-cap is up by 0.36 per cent, and the Small-cap index is down by 2.18 per cent. The PSU Bank index continues to rally by 3.68 per cent. The Pharma and Metal indices are up by 1.98 per cent each. The Nifty Media and IT indexes are down by 1.56 per cent and 1.11 per cent, respectively. In this month’s last six trading sessions, the FIIs bought Rs10,128.15 crore, and DIIs bought another Rs13,898.99 crore worth of equities. The market breadth was negative except on Thursday.
For the last three weeks, the Nifty formed higher high candles by closing above the prior week’s high and forming new lifetime highs. The current upswing is six weeks old. The index has been forming similar candles - Hanging Man, for the last four weeks. The 10-week average is in a strong uptrend and acting as support. Expanding Bollinger bands also suggest there is an imminent consolation or a counter-trend in the near term. As the trend continues without any reasonable consolidation, several elements of doubt are rising.
The volume trend is not encouraging. As a rule, a new high without volume support is not a good sign. For the last five weeks, the volumes have been declining. During the last week, the volume of the first three days was much below the average. On Thursday, the indecisive candle formed at an above-average volume. Importantly, the market breadth is extremely negative. Even on Wednesday, a massive 273 points move from the day’s low; it also has an extremely negative advance-decline ratio and below-average volume. Importantly, the relative strength still needs to be improved. With these negative factors, doubts arise about the sustaining trend. The weekly RSI is about to make a new high, and the daily RSI is hovering around the 60 zone. The daily MACD histogram shows a dull momentum. Normally, at a lifetime high, the trend strength indicator ADX will be above 25, But this time, the daily ADX is at 13.34 and declining.
(The author is Chief Mentor, Indus School of Technical Analysis, Financial Journalist, Technical Analyst, Trainerand Family Fund Manager)


