Live
- NASA Tracks Five Giant Asteroids on Close Approach to Earth Today
- Pushpa 2 Hits ₹1000 Crore in 6 Days: How It Compares to Other Top Indian Films
- Vivo X200 and X200 Pro Launched in India: Price, Specifications, and Features
- Nitin Gadkari Admits Feeling Embarrassed at Global Summits Over Rising Road Accidents in India
- Comprehensive Review on Indiramma Housing Survey and Welfare Initiatives Conducted via Video Conference
- Jogulamba Temple Records Rs 1.06 Crore Hundi Revenue in 150 Days
- Opposition Slams ‘One Nation, One Election’ Bill as Anti-Democratic; BJP Allies Support the Move
- Celebrate Karthigai Maha Deepam Virtually with Sri Mandir’s LIVE Darshan Experience
- BJP Extends Support to Samagra Shiksha Abhiyan Employees' Strike, Demands Immediate Regularization and Welfare Benefits
- Dr. M. Priyanka Stresses Quality Education, Nutritious Meals, and Cleanliness in Schools
Just In

SECC paints a sad picture of rural India. The Socio Economic and Caste Census (SECC) 2011 released recently provides us with a reality check on rural India, indicating that one out of three families living in villages is landless and depends on manual labour for livelihood.
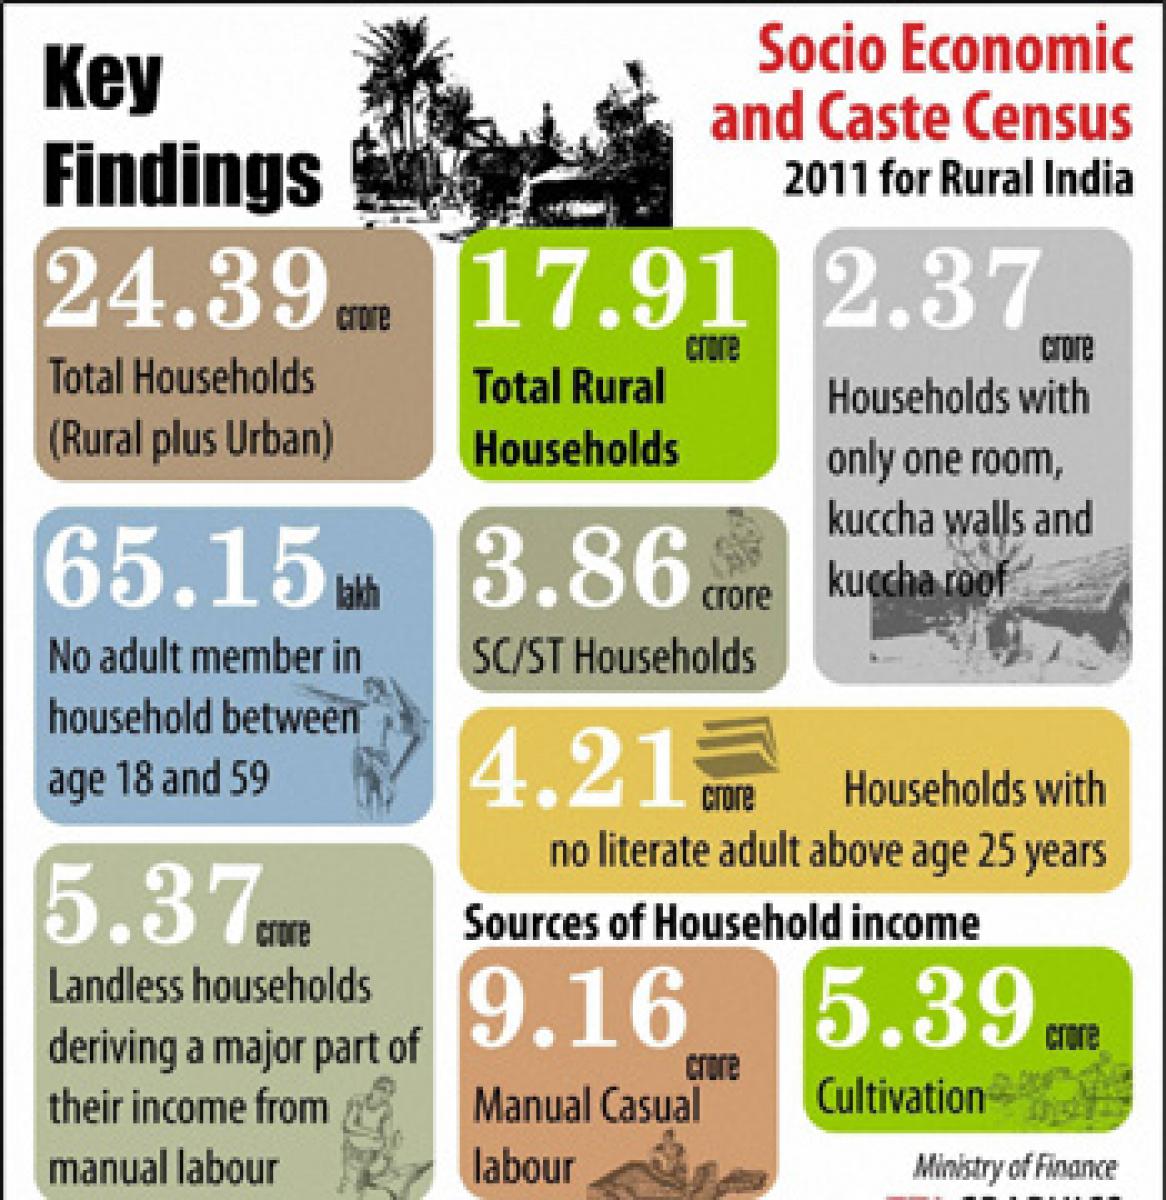
 The Socio Economic and Caste Census (SECC) 2011 released recently provides us with a reality check on rural India, indicating that one out of three families living in villages is landless and depends on manual labour for livelihood. The SECC 2011, also the first paperless census conducted on hand-held electronic devices by the government, said 23.52% rural families have no literate adult above 25 years, suggesting a poor state of education among rural masses.
The census was carried out in 640 districts under the aegis of the Rural Development Ministry. According to the census, there are a total number of 24.39 crore households in the country, of which 17.91 crore live in villages. Of these, 10.69 crore households are considered as deprived. The deprivation data reveal that 5.37 crore (29.97 per cent) households in rural areas are “landless deriving a major part of their income from manual labour.” 2.37 crore (13.25 per cent) families in villages live in houses of one room with ‘kaccha’ walls and roof.
“SECC data would have meaningful use in housing for all, education and skills thrust, MGNREGA, National Food Security Act, interventions for differently-abled, interventions for women-led households, and targeting of households/individual entitlements on evidence of deprivation, etc,” release from the Ministry of Rural Development sais. Also, the Ministry of Rural Development, in consultation with states, is trying to implement a convergent and integrated poverty reduction plan with Gram Panchayats and deprived households as priority, the release added.
The census further said just 4.6 per cent of all rural households in the country pay income tax. On sources of income, the data said that as many as 5.39 crore (30.10 per cent) out of total rural households depended on crop cultivation for sustenance, 9.16 crore (51.14 per cent) earned income through manual casual labour. Some 44.84 lakh worked as domestic helps, 4.08 lakh were rag pickers and 6.68 lakh beggars. According to the data, there were 13.34 crore or 74.49 per cent households where “monthly income of highest earning household member” was below Rs 5,000 a month.
There were only 1.48 crore or 8.29 per cent of rural households where the monthly income of such member was Rs 10,000 or more. Further, the number of rural households with a salaried job was only 9.68 per cent. Of these, 5.02 per cent were in government jobs, 1.12 per cent were employed in public sector and the remaining 3.58 per cent in private sector, the data said. According to PTI, the government refrained from releasing the caste-based census data.
Brushing aside suggestions that government avoided giving the caste count in the survey report due to political reasons ahead of Bihar polls, Rural Development Minister Chaudhary Birender Singh said, “There is no such thing. Connecting it with elections is not good.” The release of caste data is considered a political hot potato and there are strong views for and against it, which were voiced even five six years back, when the process for the SECC had begun during the UPA government.
Those who opposed it were apprehensive that it could open a pandora’s box and could lead to demands for a fresh look at reservation. According to the released data, 29.43 per cent of the households belong to the Scheduled Castes (SC) and Scheduled Tribes (ST) category across the country. Punjab leads the the states with the highest number of SC population with 36.74 per cent, followed by West Bengal (28.45 per cent), Tamil Nadu (25.55 per cent) and Himachal Pradesh (23.97 per cent).
As far as ST population is concerned, Mizoram has the highest percentage with 98.79 per cent, followed by Lakshadweep (96.59 per cent), Nagaland (93.91 per cent) and Meghalaya (90.36 per cent). The average percentages of SC and ST category are 18.46 per cent and 10.97 per cent, respectively. A substantial difference was found in the standard of living of India’s SC and ST and others. Fewer than five per cent of SC and ST households were found to have a person who earned more than Rs 10,000 per month. For other communities, there were twice as many households.

© 2024 Hyderabad Media House Limited/The Hans India. All rights reserved. Powered by hocalwire.com


