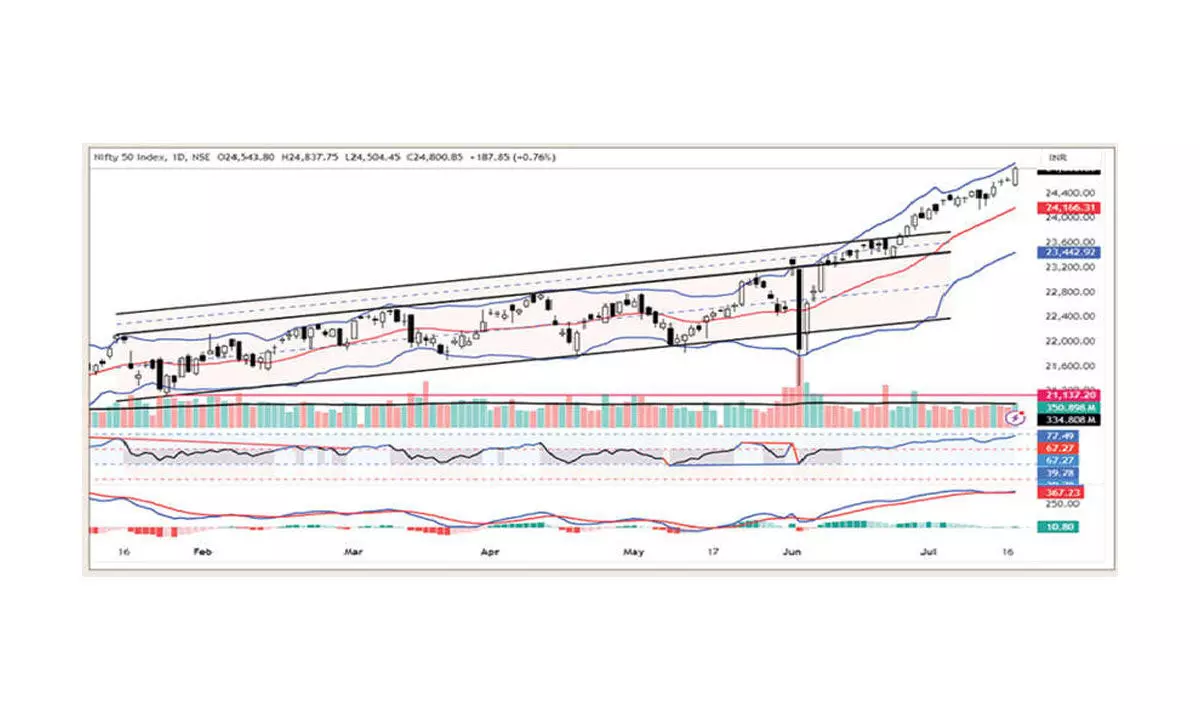
Charts signal caution for day traders

he equities are new with the IT and Reliance rally. NSE Nifty gained by 187.85 points or 0.76 per cent
The equities are new with the IT and Reliance rally. NSE Nifty gained by 187.85 points or 0.76 per cent. The IT index is the top gainer with 2.22 per cent. The FMCG and Services indices are up by 0.96 per cent and 0.85 per cent. The PSE and CPSE were the worst hits at 1.37 per cent and 1.25 per cent. The small-cap is down by 1.22 per cent. All the indices were gained or declined with a moderate. The India VIX is up by 2.02 per cent to 14.15. The market breadth is negative as 1,793 declines and 932 advances. About 145 stocks hit a new 52-week high, and 108 traded in the lower circuit. HAL, HDFC Bank, TCS, and IREDA were the top trading counters today in terms of value.
Another massive move in IT stocks led the Nifty to surpass the 24,800 level. Now, the Nifty has met all the pattern targets, including the extension level. It opened with a negative gap and registered y-o-y movements till the afternoon. A massive 333.30 points move from the day’s low after the first two hours of trading forced to square off the short positions. The interesting data point is that the declines are double to the gainers. The advance-declines ratio is one of the crucial indicators of broader market weakness. The volumes were higher than in previous days, which is a positive to consider. But the question is, just two days before the budget, the index shows such a massive move, which contradicts the previous moves. Normally, the equities consolidate before a big event like the budget. This different behaviour is raising doubts about post-budget moves. The RSI is now at the extreme zone. Both daily and weekly RSI are in the neat extreme levels of 77.40 and 77.32, which is a caution. The Bollinger bands are also vertically rising, and the index is almost at the upper band. The high volume of the last hour is because of derivative expiry trades. The hourly moving average ribbon acted as a strong support during a negative opening. With today’s move, the MACD histogram shows a strong momentum. Let’s watch the index move in the next two days. Looking at the stocks, the index is in the Extreme zone. In any case, the index closing below the prior high will demonstrate the weakness. But just before the budget is, nothing will work out. Protect capital and position with a top priority.
(The author is Chief Mentor, Indus School of Technical Analysis, Financial Journalist, Technical Analyst, Trainer and Family Fund Manager)


