Weakening signals from markets

Last week, Indian stock markets traded in a narrow range.
Last week, Indian stock markets traded in a narrow range. The BSE Sensex declined by 402 points and the Nifty fell by 21.75 points in last five trading sessions. The other major index, Bank Nifty, declined by 146 points.
The broader indices, Nifty Midcap-100 index, fell 0.45 per cent, but Nifty Smallcap index rose by 54 points. Once again, a crisis of fixed maturity plans redemption postponement dampened the investor's sentiment. The first phase of parliamentary elections was over and the next phase of election is due next week.
Technically, Nifty's long-legged doji in last week got confirmation as it ended below the doji close. It actually formed a lower low and lower high on a weekly chart, which reveals that the sign of the upward momentum is clearly waning and the bulls are tired.
As we discussed last week, the critical level 11,560 for the week was broken for a very short period during the week. Even for the next week also, it acts as a point of control for the bulls. As long as Nifty trades above this level, traders will not get a good shorting opportunity.
At the same time, 11710 will act as a critical resistance for next week. Between these two levels, the market tries to consolidate and trading opportunities elude in the index. The volumes have decreased last week with negative advance-decline ratio most of the days.
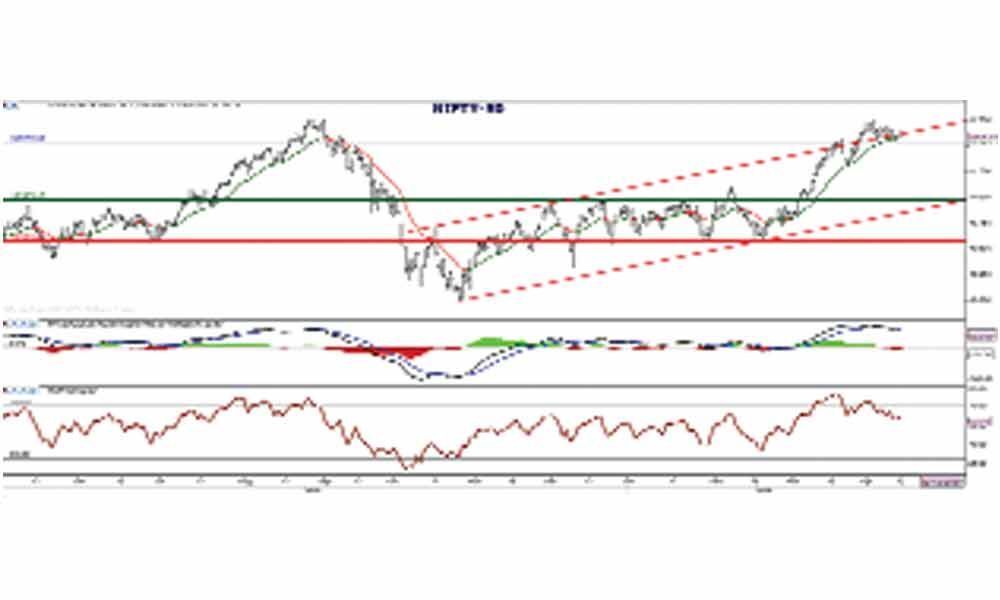
On a daily chart, the breakout of the upward channel did not sustain for many days and closed within the channel for two days. On Friday once again, it closed above the channel resistance.
This price action gives scepticism on future up move. Even the derivative segment is suggesting that 11,700-11,500 range will continue for some more days. Either side of the breakout will lead the sharper move.
The negative divergence in indicators continues. Friday's move has not helped the indicators to turn positive. The RSI is still below 63, which is prior swing low and confirmation point for the negative divergence.
The MACD histogram is increasing even as the market moved up on Friday. Stochastic oscillator came down to 65 range. With these signs, there are indications that the market is weakening. But there is no confirmation for bearishness.
As the market is consolidating within range for the last week, let us wait for the range to break. As long as markets remain within the range, there will not be clear trading opportunities.
But once it breaks the range, the sharper move can be seen either side of the direction. Fundamentally, Nifty Price to Earning ratio still above 29 which in overvalue and bubble zone.
Q4 results began on Friday with the mixed performance of two IT majors. Next week, some Nifty companies will announce results. The market may witness knee-jerk reactions to financial performance.
(The author is a financial journalist and technical analyst. He can be reached at [email protected])


